







ERIC LAWRENCE FRAZIER ADVISORY SERVICES
Real Estate Investor Magazine
California HUD Properties
Evaluate California HUD homes with a clear view of costs, financing, and the questions to ask before you bid.
Published by Eric Lawrence Frazier, MBA · Eric Lawrence Frazier Advisory Services, a sole proprietorship.
WEEKLY CALIFORNIA EDITION
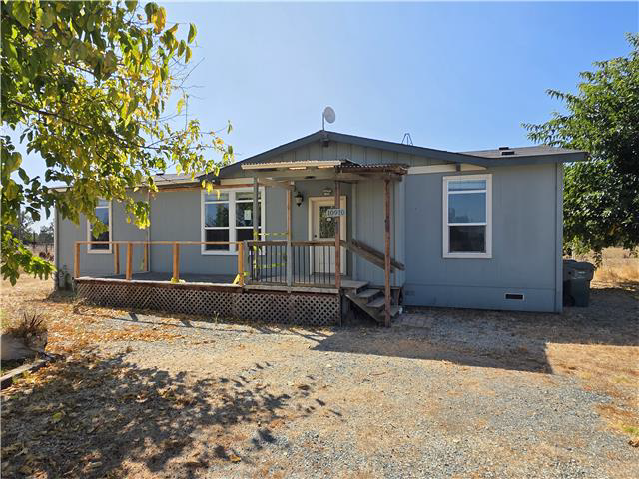
10910 Darr Lane, Wilton
Sacramento County · 2 beds · 2 baths · 1,490 sq ft · $570,000 asking at time of check
HUD case 049-175709 · Check availability and bid eligibility · View cover property on Google MapsPhoto source: HUD Home Store. HUD case and bidder eligibility checked November 15, 2026, at 9:35 p.m. Pacific.
California HUD homes to consider now
If you’re buying a home to live in or looking for your next investment, start with the official HUD case page. Check who can bid, when bids are due and what the condition report says before deciding what to offer.
- Buying to live in the home? Get a property-specific loan quote. If repairs are needed, ask an FHA-approved lender whether a 203(k) renovation loan fits the home and the work.
- Buying as an investor? Verify achievable rent, repairs and operating expenses before calculating what you can offer at a 7% or 8% cap rate.
Three properties to start with
Asking prices from the November 13, 2026 inventory check. Follow each link to confirm current status.
- 1217 Woodman Way, Modesto · $320,000 asking
- 1221 Seven Hills Dr, Hemet · $240,000 asking
- 907 Neville St, Hanford · $208,000 asking
Browse the current California inventory on HUD Home Store
Your power is now to act.
Mortgage rate benchmarks
- 7.11% conventional 30-year fixed · November 12, 2026 · Freddie Mac
- 7.05% FHA 30-year fixed · November 13, 2026 · Mortgage News Daily
- 7.42% investor DSCR 30-year fixed · November 13, 2026 · Harpoon Capital’s benchmark for a specific borrower, loan and property profile.
These are published interest-rate benchmarks. Get a written quote for the specific property and program, including FHA 203(k) when applicable. Compare the APR, points, mortgage insurance where applicable, and total cash to close.
Call 800-261-1634 ext. 703 · Schedule a free discovery call
Editor’s note
This issue covers California properties that HUD Home Store showed as All Bidders on November 13, 2026. Confirm current availability, bidder eligibility and the deadline on the individual case page. Review the condition report and addenda before pricing repairs or evaluating financing.
The cover is 10910 Darr Lane in Wilton, a two-bedroom manufactured home listed at $570,000 at our check. Start by confirming how the home and land are titled and whether your lender will finance them together. The Corning listing at 1086 Houghton Avenue is a four-bedroom home listed at $271,000. For that property, review the condition report and get repair estimates before comparing its total cost with nearby sales and rents. Those two properties call for different due diligence even though both were listed for investor bids.
Freddie Mac’s November 12 survey puts the national 30-year fixed mortgage average at 7.11%, down from 7.18% a week earlier. California’s September existing single-family sales pace fell 6.5% from a year earlier, while the statewide median rose 1.7% to $899,720. Use the rate survey to track borrowing conditions, then get a quote for your specific property and loan. Use local comparable sales and rents to judge your exit price and income.
Before you bid, estimate how long you can carry the property with no rental income. Run the numbers again with higher repair costs and a longer vacancy, then set a bid ceiling you can stick to. If the property still fits your budget, take the case number and condition report to your HUD-registered broker.
HUD Home Store · Freddie Mac mortgage survey · California home sales report
California market update
California existing single-family home sales fell 3.4% from August to September and 6.5% from a year earlier. The statewide median was $899,720, up 1.7% year over year. Freddie Mac’s November 12 survey put the national 30-year fixed average at 7.11%, down from 7.18% the week before. California Association of REALTORS® · Freddie Mac mortgage survey
For a California HUD bid, use comparable sales and rents near the property and get a lender quote for your actual loan. Test what happens to cash flow if repairs cost more or the property sits vacant longer. The statewide median and national mortgage average are market context.
California HUD homes and fixer-upper FAQs
What is a HUD home, and how is it different from other foreclosure listings?
A HUD home is a property HUD acquired after foreclosure on an FHA-insured mortgage. Other foreclosures may be sold by lenders, trustees, or other owners under different rules. Start with HUD Home Store when you want to find HUD-owned homes.
How do I find California HUD homes for sale near me?
Use HUD Home Store to search by city, ZIP code, address, or case number. If you plan to buy as an investor, check the bidder types on the individual listing.
Is this HUD property still available?
Select the clickable HUD case number for the property to open its official HUD Home Store page. Check the current status, who can bid, and the deadline there. If the case page no longer opens, search by case number or contact the listing broker shown on HUD Home Store.
Can real estate investors bid on HUD foreclosures?
Check the buyer types listed on the individual case. Some listings begin with an exclusive period. Unsold homes may move into an extended period that allows investor bids.
Are HUD homes below market value?
Compare the asking price with recent nearby sales, then estimate repairs, financing, closing costs and the cost of holding the property. A low list price alone cannot establish that a home is below market value.
Are HUD fixer-uppers sold as is?
HUD generally sells its homes as is. Review the property condition report and addenda. Ask a broker about inspection access and get repair estimates before committing.
How do I make an offer on a HUD home?
A HUD-registered real estate broker submits the bid through HUD Home Store. Confirm the case number, bidder eligibility, deadline and documents with your broker before bidding.
Can I finance a HUD fixer-upper with an FHA 203(k) renovation loan?
Eligible borrowers may be able to combine a purchase and repairs through an FHA-approved lender. Confirm occupancy, property condition and rehabilitation requirements with the lender before relying on a 203(k) loan.
How do I budget for a fixer-upper I plan to resell?
Use a written scope of work and contractor estimates. Model permits, contingency, financing, utilities, taxes, insurance, holding time and selling costs. Test a lower resale price and a longer renovation before deciding what to offer.
What should I check before buying a HUD home as a rental?
Check comparable rents, vacancy, insurance, repairs, management costs and any local rental rules. Compare the expected net income with debt payments and reserves.
What is house hacking, and can I live in one unit and rent the others?
House hacking can mean living in one unit of a small multifamily property while renting the others. Confirm local rules, property eligibility and lender occupancy requirements before you bid. State your actual occupancy plans.
Can an agent speak with me about making an offer on this HUD property?
Have the HUD case number or property address ready. Call 800-261-1634 to ask about next steps.
HUD Home Store · HUD sales and bidding guidance · FHA 203(k) renovation financing
HUD Policy & Mortgagee Letters
Independent housing-policy reporting and practical context for readers of this issue.
HUD Announces Largest Decrease in Homelessness
Read the reported data, limitations, and local implications.
Mortgagee Letter 2026-13: LIHTC Express Lane
Underwriting, developer qualifications, and affordable-housing construction.
Investor tools
Choose a tool to run an analysis here in the magazine. To keep a report, sign in to your member account.
California HUD listings for investors
Investor recommendations
Each listing below includes an educational Deal Analyzer illustration using the displayed HUD asking price and clearly identified modeling assumptions. HUD bidder eligibility determines who can bid. Our investment screen compares supported rental income and operating expenses with the asking price, then evaluates financing, cash required and renovation scenarios.
California investor listing index
The HUD Home Store California Investor filter returned 25 cases on . We checked the case numbers and asking prices for all 24 listings in this edition against those results. The figures on each card are income targets calculated from the asking price. Use local rent evidence and operating costs to see what each property can support. Open the official case page for current availability, bidder eligibility, deadlines, and addenda.
Browse the California homebuyer edition
10910 Darr Ln
Wilton, CA 95693
$570,000 asking
At the asking price
$3,800/mo gross rent for an 8% gross yield
$34,200/yr NOI for a 6% cap rate
$45,600/yr NOI for an 8% cap rate
Illustrative Deal Analyzer · 10910 Darr Ln
Educational scenarios, not a rent appraisal, lender quote, repair bid, or offer recommendation. Asking price is from the displayed HUD listing snapshot; every other amount below is a modeling assumption. Confirm listing status and bidding rules with HUD.
Investor scenario · 7% and 8% cap-rate illustrations
Expenses: 1.2% of asking for property tax; 0.5% for insurance; 5% of gross rent for vacancy; 8% maintenance; 8% management; 5% capital reserves; 3% miscellaneous. Cap-rate prices equal modeled NOI divided by 0.07 or 0.08. Financing and acquisition costs are excluded from cap-rate calculations.
Investor financing illustration
Financing assumes purchase at the displayed asking price. Cash flow excludes closing costs, points, taxes on investor income, and property-specific unexpected repairs. Lending terms and qualification differ by borrower.
Owner-occupant purchase and renovation illustration
A possible FHA 203(k) renovation illustration only. Actual eligible acquisition and repair amounts, the financed base, minimum investment, mortgage insurance, escrow, interest rate, closing costs, contractor bids and lender approval must be determined separately. The repair allowance is a placeholder, not an estimate of the property’s condition.
Before deciding: Confirm allowable HUD bidder category and bid deadline; obtain current rent comparables, condition report, insurance and tax quotes, inspection and renovation bids, and written financing terms. Check HUD case 049-175709.
Investment Property Analysis
10910 Darr Ln, Wilton, California · HUD Case 049-175709
ILLUSTRATIVE INVESTMENT ANALYSISPrepared November 16, 2026 · Eric Lawrence Frazier, MBA · DRE 01143484 · NMLS 461807
01 · Acquisition Summary & Investment Decision
The HUD asking price is $570,000. This report evaluates whether the property could support a 7% or 8% capitalization-rate investment and separately describes an owner-occupant purchase. The available source does not establish obtainable rent, condition-adjusted value, contractor costs, insurability or lender eligibility. Consequently, an investment purchase recommendation is withheld pending diligence, not converted from hypothetical rents into a false offer.
Property facts
Manufactured Home; 2 bedrooms, 2 baths, 1490 square feet. HOA: $0 monthly. HUD financing classification: IE.
Investor rental restrictions, HOA disclosures, property damage and occupancy have not been independently reviewed.
Evidence classification
HUD listing data Prior official page check for the values shown; current marketability requires recheck.
Modeled assumptions All rents and expense percentages in this report are sensitivity illustrations, not property-specific comps or bids.
02 · Investor Underwriting Method and Required Rent
These are reverse-underwriting scenarios: they calculate the monthly rent the listing would need to justify the asking price at target capitalization rates. They do not claim those rents can be collected. A local market-rent study, unit condition and rental restrictions must determine the actual rent input.
| Measure | 7% target scenario | 8% target scenario |
|---|---|---|
| Required monthly rent | $5,621 | $6,197 |
| Required annual scheduled rent | $67,452 | $74,364 |
| Annual NOI at that hypothetical rent | $39,905 | $45,601 |
| Target yield | 7.00% | 8.00% |
| Monthly rent as % of listing price | 0.99% | 1.09% |
03 · Operating Statement — Year One
Property-specific accounting: 5% vacancy, management equal to 8% of effective income, annual replacement reserve at 5% of gross rents, 1% of asking price for ordinary maintenance, 1.25% tax, 0.5% insurance, and the indicated HOA fee. These are underwriting inputs only; none substitutes for tax records, insurance quotation or service contracts.
| Income / expense line | 7% reverse scenario | 8% reverse scenario |
|---|---|---|
| Gross scheduled rent · threshold assumption | $67,452 | $74,364 |
| Vacancy/credit loss (5%) | −$3,373 | −$3,718 |
| Effective gross income | $64,079 | $70,646 |
| Management (8% of effective income) | −$5,126 | −$5,652 |
| Replacement reserve (5% gross) | −$3,373 | −$3,718 |
| Maintenance reserve (1% price) | −$5,700 | −$5,700 |
| Illustrative tax (1.25% price) | −$7,125 | −$7,125 |
| Illustrative insurance (0.5% price) | −$2,850 | −$2,850 |
| HOA per listing | −$0 | −$0 |
| Total operating costs and reserves | −$24,174 | −$25,045 |
| MODELED NOI | $39,905 | $45,601 |
| Cap rate at HUD asking price | 7.00% | 8.00% |
NOI includes an analytical replacement reserve for conservative modeling; lenders and appraisers may use different standardized definitions. Costs grow with rent only where explicitly modeled below; taxes and insurance are held at the initial price proxy for this working model.
04 · Financing & Capital Required — Investor
Illustrative financing assumes 25% down, 75% loan-to-value, fixed 8.00% annual interest and 30-year amortization. This is not a current lender quote. Investment property financing eligibility, DSCR loan sizing, property type restrictions, credit underwriting and insurance may invalidate this structure.
| Financing item | Modeled amount |
|---|---|
| Purchase price | $570,000 |
| 25% investor down payment | $142,500 |
| Illustrative first mortgage | $427,500 |
| Estimated closing cost at 3% | $17,100 |
| Total initial cash requirement before repairs/reserves | $159,600 |
| Monthly principal & interest at assumed 8% | $3,137 |
| Annual debt service | $37,642 |
| NOI / debt service (7% reverse scenario) | 1.06× |
| Year-one pre-tax cash flow at reverse rent | $2,263 |
| Year-one cash-on-cash on modeled initial cash | 1.42% |
05 · Owner-Occupant and Rehabilitation Path
If a qualified buyer intends to occupy the property, an FHA 203(k) rehabilitation mortgage may be relevant depending on appraisal, condition, eligibility and lender requirements. The arithmetic below uses a simplified 3.5% minimum-equity illustration on the asking price before a verified rehabilitation budget. Financing of improvements, contingencies, financeable fees, limits and valuation is lender-specific.
| Owner-occupant illustration | Before rehab |
|---|---|
| Acquisition price | $570,000 |
| Illustrative 3.5% down on price | $19,950 |
| Base loan before financed fees or repairs | $550,050 |
| Illustrative P&I at an assumed 7% / 30 years | $3,659/month |
| Mortgage insurance, property tax, HOA, homeowners insurance | Not included |
| Contractor bid, contingency, feasibility review | Required |
| FHA renovation total and actual 3.5% cash | Not established |
HUD classification review: HUD class IE: listing classification is not an FHA commitment; appraisal, property condition, rehabilitation scope and underwriting govern.
For an owner-occupant example with verified repairs B, an initial 3.5% illustration is 0.035 × (HUD purchase price + eligible financed rehabilitation costs B), subject to the maximum-mortgage and 203(k) calculations. This is not a statement that every repair dollar is financeable.
06 · Ten-Year Income, Debt and Equity Model
This sensitivity model begins with the required 7% rent—again, a hypothetical threshold, not observed rent—and assumes 3% annual rent growth. It holds fixed price-linked operating expense proxies constant and applies management/reserves to growing rent. The fixed-rate 8% mortgage amortizes over 30 years. Repairs, special assessments, tax reassessments, depreciation, income taxes, rent-control restrictions and major capital events are excluded. The model is not a forecast.
| Year | Monthly rent | NOI | Debt service | Pre-tax cash flow | Loan balance |
|---|---|---|---|---|---|
| Year 1 | $5,621 | $39,905 | $37,642 | $2,263 | $423,929 |
| Year 2 | $5,790 | $41,573 | $37,642 | $3,931 | $420,061 |
| Year 3 | $5,963 | $43,290 | $37,642 | $5,648 | $415,873 |
| Year 4 | $6,142 | $45,059 | $37,642 | $7,417 | $411,336 |
| Year 5 | $6,326 | $46,881 | $37,642 | $9,239 | $406,424 |
| Year 6 | $6,516 | $48,758 | $37,642 | $11,116 | $401,103 |
| Year 7 | $6,712 | $50,691 | $37,642 | $13,049 | $395,341 |
| Year 8 | $6,913 | $52,682 | $37,642 | $15,040 | $389,101 |
| Year 9 | $7,121 | $54,733 | $37,642 | $17,091 | $382,342 |
| Year 10 | $7,334 | $56,845 | $37,642 | $19,203 | $375,023 |
At year ten, scheduled monthly rent would be $7,334 and NOI $56,845, conditional on uninterrupted growth and the initial unverified rent assumption. Cumulative ten-year pre-tax operating cash flow is $103,996 before exit.
07 · Exit Analysis and Sensitivity
At a hypothetical 7.50% terminal cap rate, the year-ten NOI produces a gross exit valuation of $757,932. After assumed 6% selling expenses and debt payoff, the sale would return approximately $337,433 before tax and any unmodeled capital costs. The ten-year illustrative internal rate of return (IRR) is 11.85%, calculated using modeled initial cash, ten annual cash flows and net year-ten sale proceeds. This value is highly sensitive to achievable rents, terminal cap rates and actual property condition.
Ten-year illustrative IRR: rent-growth / exit-cap sensitivity
| Annual rent growth | 6.50% exit cap | 7.50% exit cap | 8.50% exit cap |
|---|---|---|---|
| 1.00% | 7.92% | 4.47% | 0.85% |
| 3.00% | 14.39% | 11.85% | 9.45% |
| 5.00% | 19.49% | 17.35% | 15.41% |
The table is a genuine 10-year cash-flow IRR calculation on the hypothetical reverse-underwriting starting rent. It is not a market-supported expected return. It excludes tax, material repairs, special assessments, insurance spikes and other due-diligence unknowns.
08 · Market, Condition and Compliance Review
Market rent comparables
Unverified. Obtain at least three currently available or recently leased comparable homes, with addresses, bedroom count, condition, date, source, asking versus achieved rent, and documented adjustments.
Condition and capital work
Unverified. Review the HUD property-condition report, addenda, utilities, pest, roof, HVAC, foundation and occupancy, then obtain scope-specific contractor bids and a contingency allowance.
Property operating data
Unverified. Retrieve county tax record, homeowner/hazard insurance quote, actual HOA dues and rental restrictions, municipal license requirements, utilities and property management proposals.
Regulatory review
Unverified. Confirm county/city rent regulation, AB 1482 applicability and exemptions, short-term rental restrictions, local safety and occupancy rules, and HUD bidding eligibility.
09 · Sources, Limitations and Editorial Decision
HUD Home Store — Case 049-175709 (primary source) · HUD property flyer · Official HUD inventory
HUD properties may be placed under contract or sold between editorial preparation and reader access. Readers must confirm current status, eligibility, bid periods, fees, disclosures and price at the source immediately before action. Your Power Is Now to act—but only on verified information.
This independent educational analysis is not a HUD publication, appraisal, broker price opinion, financing commitment or assurance of investment return. All target-rent scenarios, modeled costs, rates, projections and valuations are explicitly hypothetical. This research draft should not be inserted into a member issue without source evidence, final arithmetic verification and author approval.
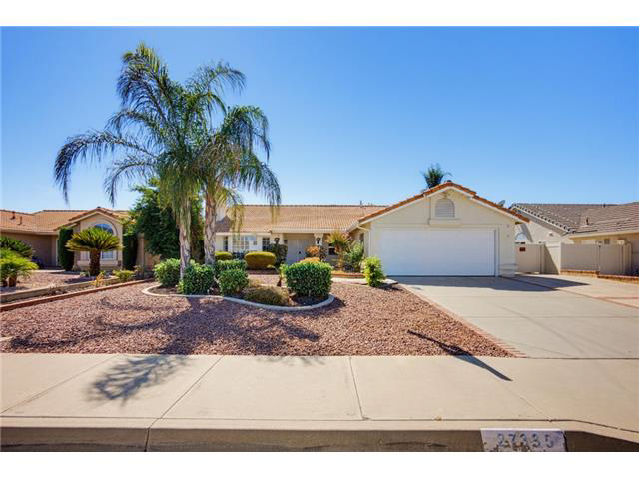
27335 Potomac Dr
Sun City, CA 92586
$437,000 asking
At the asking price
$2,914/mo gross rent for an 8% gross yield
$26,220/yr NOI for a 6% cap rate
$34,960/yr NOI for an 8% cap rate
Illustrative Deal Analyzer · 27335 Potomac Dr
Educational scenarios, not a rent appraisal, lender quote, repair bid, or offer recommendation. Asking price is from the displayed HUD listing snapshot; every other amount below is a modeling assumption. Confirm listing status and bidding rules with HUD.
Investor scenario · 7% and 8% cap-rate illustrations
Expenses: 1.2% of asking for property tax; 0.5% for insurance; 5% of gross rent for vacancy; 8% maintenance; 8% management; 5% capital reserves; 3% miscellaneous. Cap-rate prices equal modeled NOI divided by 0.07 or 0.08. Financing and acquisition costs are excluded from cap-rate calculations.
Investor financing illustration
Financing assumes purchase at the displayed asking price. Cash flow excludes closing costs, points, taxes on investor income, and property-specific unexpected repairs. Lending terms and qualification differ by borrower.
Owner-occupant purchase and renovation illustration
A possible FHA 203(k) renovation illustration only. Actual eligible acquisition and repair amounts, the financed base, minimum investment, mortgage insurance, escrow, interest rate, closing costs, contractor bids and lender approval must be determined separately. The repair allowance is a placeholder, not an estimate of the property’s condition.
Before deciding: Confirm allowable HUD bidder category and bid deadline; obtain current rent comparables, condition report, insurance and tax quotes, inspection and renovation bids, and written financing terms. Check HUD case 048-425809.
Investment Property Analysis
27335 Potomac Dr, Sun City, California · HUD Case 048-425809
ILLUSTRATIVE INVESTMENT ANALYSISPrepared November 16, 2026 · Eric Lawrence Frazier, MBA · DRE 01143484 · NMLS 461807
01 · Acquisition Summary & Investment Decision
The HUD asking price is $437,000. This report evaluates whether the property could support a 7% or 8% capitalization-rate investment and separately describes an owner-occupant purchase. The available source does not establish obtainable rent, condition-adjusted value, contractor costs, insurability or lender eligibility. Consequently, an investment purchase recommendation is withheld pending diligence, not converted from hypothetical rents into a false offer.
Property facts
Single Family Home; 2 bedrooms, 2 baths, 1578 square feet. HOA: $38 monthly. HUD financing classification: IE.
Investor rental restrictions, HOA disclosures, property damage and occupancy have not been independently reviewed.
Evidence classification
HUD listing data Prior official page check for the values shown; current marketability requires recheck.
Modeled assumptions All rents and expense percentages in this report are sensitivity illustrations, not property-specific comps or bids.
02 · Investor Underwriting Method and Required Rent
These are reverse-underwriting scenarios: they calculate the monthly rent the listing would need to justify the asking price at target capitalization rates. They do not claim those rents can be collected. A local market-rent study, unit condition and rental restrictions must determine the actual rent input.
| Measure | 7% target scenario | 8% target scenario |
|---|---|---|
| Required monthly rent | $4,355 | $4,797 |
| Required annual scheduled rent | $52,260 | $57,564 |
| Annual NOI at that hypothetical rent | $30,595 | $34,965 |
| Target yield | 7.00% | 8.00% |
| Monthly rent as % of listing price | 1.00% | 1.10% |
03 · Operating Statement — Year One
Property-specific accounting: 5% vacancy, management equal to 8% of effective income, annual replacement reserve at 5% of gross rents, 1% of asking price for ordinary maintenance, 1.25% tax, 0.5% insurance, and the indicated HOA fee. These are underwriting inputs only; none substitutes for tax records, insurance quotation or service contracts.
| Income / expense line | 7% reverse scenario | 8% reverse scenario |
|---|---|---|
| Gross scheduled rent · threshold assumption | $52,260 | $57,564 |
| Vacancy/credit loss (5%) | −$2,613 | −$2,878 |
| Effective gross income | $49,647 | $54,686 |
| Management (8% of effective income) | −$3,972 | −$4,375 |
| Replacement reserve (5% gross) | −$2,613 | −$2,878 |
| Maintenance reserve (1% price) | −$4,370 | −$4,370 |
| Illustrative tax (1.25% price) | −$5,463 | −$5,463 |
| Illustrative insurance (0.5% price) | −$2,185 | −$2,185 |
| HOA per listing | −$450 | −$450 |
| Total operating costs and reserves | −$19,052 | −$19,721 |
| MODELED NOI | $30,595 | $34,965 |
| Cap rate at HUD asking price | 7.00% | 8.00% |
NOI includes an analytical replacement reserve for conservative modeling; lenders and appraisers may use different standardized definitions. Costs grow with rent only where explicitly modeled below; taxes and insurance are held at the initial price proxy for this working model.
04 · Financing & Capital Required — Investor
Illustrative financing assumes 25% down, 75% loan-to-value, fixed 8.00% annual interest and 30-year amortization. This is not a current lender quote. Investment property financing eligibility, DSCR loan sizing, property type restrictions, credit underwriting and insurance may invalidate this structure.
| Financing item | Modeled amount |
|---|---|
| Purchase price | $437,000 |
| 25% investor down payment | $109,250 |
| Illustrative first mortgage | $327,750 |
| Estimated closing cost at 3% | $13,110 |
| Total initial cash requirement before repairs/reserves | $122,360 |
| Monthly principal & interest at assumed 8% | $2,405 |
| Annual debt service | $28,859 |
| NOI / debt service (7% reverse scenario) | 1.06× |
| Year-one pre-tax cash flow at reverse rent | $1,736 |
| Year-one cash-on-cash on modeled initial cash | 1.42% |
05 · Owner-Occupant and Rehabilitation Path
If a qualified buyer intends to occupy the property, an FHA 203(k) rehabilitation mortgage may be relevant depending on appraisal, condition, eligibility and lender requirements. The arithmetic below uses a simplified 3.5% minimum-equity illustration on the asking price before a verified rehabilitation budget. Financing of improvements, contingencies, financeable fees, limits and valuation is lender-specific.
| Owner-occupant illustration | Before rehab |
|---|---|
| Acquisition price | $437,000 |
| Illustrative 3.5% down on price | $15,295 |
| Base loan before financed fees or repairs | $421,705 |
| Illustrative P&I at an assumed 7% / 30 years | $2,806/month |
| Mortgage insurance, property tax, HOA, homeowners insurance | Not included |
| Contractor bid, contingency, feasibility review | Required |
| FHA renovation total and actual 3.5% cash | Not established |
HUD classification review: HUD class IE: listing classification is not an FHA commitment; appraisal, property condition, rehabilitation scope and underwriting govern.
For an owner-occupant example with verified repairs B, an initial 3.5% illustration is 0.035 × (HUD purchase price + eligible financed rehabilitation costs B), subject to the maximum-mortgage and 203(k) calculations. This is not a statement that every repair dollar is financeable.
06 · Ten-Year Income, Debt and Equity Model
This sensitivity model begins with the required 7% rent—again, a hypothetical threshold, not observed rent—and assumes 3% annual rent growth. It holds fixed price-linked operating expense proxies constant and applies management/reserves to growing rent. The fixed-rate 8% mortgage amortizes over 30 years. Repairs, special assessments, tax reassessments, depreciation, income taxes, rent-control restrictions and major capital events are excluded. The model is not a forecast.
| Year | Monthly rent | NOI | Debt service | Pre-tax cash flow | Loan balance |
|---|---|---|---|---|---|
| Year 1 | $4,355 | $30,595 | $28,859 | $1,736 | $325,012 |
| Year 2 | $4,486 | $31,887 | $28,859 | $3,028 | $322,047 |
| Year 3 | $4,620 | $33,217 | $28,859 | $4,358 | $318,836 |
| Year 4 | $4,759 | $34,588 | $28,859 | $5,729 | $315,358 |
| Year 5 | $4,902 | $35,999 | $28,859 | $7,140 | $311,591 |
| Year 6 | $5,049 | $37,453 | $28,859 | $8,594 | $307,512 |
| Year 7 | $5,200 | $38,951 | $28,859 | $10,092 | $303,095 |
| Year 8 | $5,356 | $40,494 | $28,859 | $11,635 | $298,311 |
| Year 9 | $5,517 | $42,082 | $28,859 | $13,223 | $293,129 |
| Year 10 | $5,682 | $43,719 | $28,859 | $14,860 | $287,518 |
At year ten, scheduled monthly rent would be $5,682 and NOI $43,719, conditional on uninterrupted growth and the initial unverified rent assumption. Cumulative ten-year pre-tax operating cash flow is $80,396 before exit.
07 · Exit Analysis and Sensitivity
At a hypothetical 7.50% terminal cap rate, the year-ten NOI produces a gross exit valuation of $582,919. After assumed 6% selling expenses and debt payoff, the sale would return approximately $260,427 before tax and any unmodeled capital costs. The ten-year illustrative internal rate of return (IRR) is 11.94%, calculated using modeled initial cash, ten annual cash flows and net year-ten sale proceeds. This value is highly sensitive to achievable rents, terminal cap rates and actual property condition.
Ten-year illustrative IRR: rent-growth / exit-cap sensitivity
| Annual rent growth | 6.50% exit cap | 7.50% exit cap | 8.50% exit cap |
|---|---|---|---|
| 1.00% | 7.96% | 4.52% | 0.91% |
| 3.00% | 14.47% | 11.94% | 9.55% |
| 5.00% | 19.59% | 17.46% | 15.53% |
The table is a genuine 10-year cash-flow IRR calculation on the hypothetical reverse-underwriting starting rent. It is not a market-supported expected return. It excludes tax, material repairs, special assessments, insurance spikes and other due-diligence unknowns.
08 · Market, Condition and Compliance Review
Market rent comparables
Unverified. Obtain at least three currently available or recently leased comparable homes, with addresses, bedroom count, condition, date, source, asking versus achieved rent, and documented adjustments.
Condition and capital work
Unverified. Review the HUD property-condition report, addenda, utilities, pest, roof, HVAC, foundation and occupancy, then obtain scope-specific contractor bids and a contingency allowance.
Property operating data
Unverified. Retrieve county tax record, homeowner/hazard insurance quote, actual HOA dues and rental restrictions, municipal license requirements, utilities and property management proposals.
Regulatory review
Unverified. Confirm county/city rent regulation, AB 1482 applicability and exemptions, short-term rental restrictions, local safety and occupancy rules, and HUD bidding eligibility.
09 · Sources, Limitations and Editorial Decision
HUD Home Store — Case 048-425809 (primary source) · HUD property flyer · Official HUD inventory
HUD properties may be placed under contract or sold between editorial preparation and reader access. Readers must confirm current status, eligibility, bid periods, fees, disclosures and price at the source immediately before action. Your Power Is Now to act—but only on verified information.
This independent educational analysis is not a HUD publication, appraisal, broker price opinion, financing commitment or assurance of investment return. All target-rent scenarios, modeled costs, rates, projections and valuations are explicitly hypothetical. This research draft should not be inserted into a member issue without source evidence, final arithmetic verification and author approval.
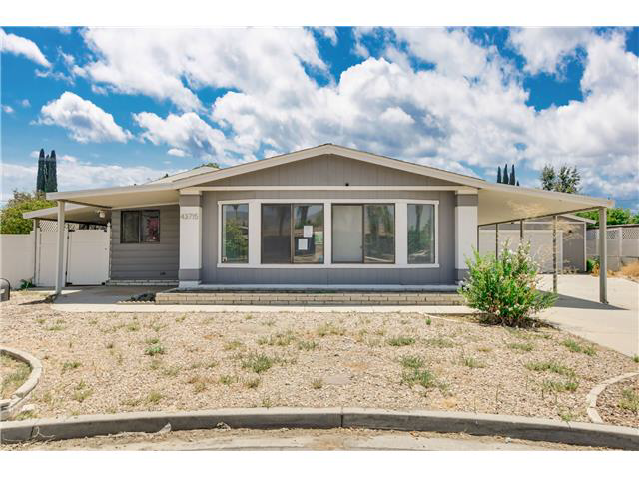
43715 Elliot Ct
Hemet, CA 92544
$393,000 asking
At the asking price
$2,620/mo gross rent for an 8% gross yield
$23,580/yr NOI for a 6% cap rate
$31,440/yr NOI for an 8% cap rate
Illustrative Deal Analyzer · 43715 Elliot Ct
Educational scenarios, not a rent appraisal, lender quote, repair bid, or offer recommendation. Asking price is from the displayed HUD listing snapshot; every other amount below is a modeling assumption. Confirm listing status and bidding rules with HUD.
Investor scenario · 7% and 8% cap-rate illustrations
Expenses: 1.2% of asking for property tax; 0.5% for insurance; 5% of gross rent for vacancy; 8% maintenance; 8% management; 5% capital reserves; 3% miscellaneous. Cap-rate prices equal modeled NOI divided by 0.07 or 0.08. Financing and acquisition costs are excluded from cap-rate calculations.
Investor financing illustration
Financing assumes purchase at the displayed asking price. Cash flow excludes closing costs, points, taxes on investor income, and property-specific unexpected repairs. Lending terms and qualification differ by borrower.
Owner-occupant purchase and renovation illustration
A possible FHA 203(k) renovation illustration only. Actual eligible acquisition and repair amounts, the financed base, minimum investment, mortgage insurance, escrow, interest rate, closing costs, contractor bids and lender approval must be determined separately. The repair allowance is a placeholder, not an estimate of the property’s condition.
Before deciding: Confirm allowable HUD bidder category and bid deadline; obtain current rent comparables, condition report, insurance and tax quotes, inspection and renovation bids, and written financing terms. Check HUD case 194-223999.
Investment Property Analysis
43715 Elliot Ct, Hemet, California · HUD Case 194-223999
ILLUSTRATIVE INVESTMENT ANALYSISPrepared November 16, 2026 · Eric Lawrence Frazier, MBA · DRE 01143484 · NMLS 461807
01 · Acquisition Summary & Investment Decision
The HUD asking price is $393,000. This report evaluates whether the property could support a 7% or 8% capitalization-rate investment and separately describes an owner-occupant purchase. The available source does not establish obtainable rent, condition-adjusted value, contractor costs, insurability or lender eligibility. Consequently, an investment purchase recommendation is withheld pending diligence, not converted from hypothetical rents into a false offer.
Property facts
Manufactured Home; 3 bedrooms, 2 baths, 1940 square feet. HOA: $0 monthly. HUD financing classification: IE.
Investor rental restrictions, HOA disclosures, property damage and occupancy have not been independently reviewed.
Evidence classification
HUD listing data Prior official page check for the values shown; current marketability requires recheck.
Modeled assumptions All rents and expense percentages in this report are sensitivity illustrations, not property-specific comps or bids.
02 · Investor Underwriting Method and Required Rent
These are reverse-underwriting scenarios: they calculate the monthly rent the listing would need to justify the asking price at target capitalization rates. They do not claim those rents can be collected. A local market-rent study, unit condition and rental restrictions must determine the actual rent input.
| Measure | 7% target scenario | 8% target scenario |
|---|---|---|
| Required monthly rent | $3,876 | $4,273 |
| Required annual scheduled rent | $46,512 | $51,276 |
| Annual NOI at that hypothetical rent | $27,518 | $31,444 |
| Target yield | 7.00% | 8.00% |
| Monthly rent as % of listing price | 0.99% | 1.09% |
03 · Operating Statement — Year One
Property-specific accounting: 5% vacancy, management equal to 8% of effective income, annual replacement reserve at 5% of gross rents, 1% of asking price for ordinary maintenance, 1.25% tax, 0.5% insurance, and the indicated HOA fee. These are underwriting inputs only; none substitutes for tax records, insurance quotation or service contracts.
| Income / expense line | 7% reverse scenario | 8% reverse scenario |
|---|---|---|
| Gross scheduled rent · threshold assumption | $46,512 | $51,276 |
| Vacancy/credit loss (5%) | −$2,326 | −$2,564 |
| Effective gross income | $44,186 | $48,712 |
| Management (8% of effective income) | −$3,535 | −$3,897 |
| Replacement reserve (5% gross) | −$2,326 | −$2,564 |
| Maintenance reserve (1% price) | −$3,930 | −$3,930 |
| Illustrative tax (1.25% price) | −$4,913 | −$4,913 |
| Illustrative insurance (0.5% price) | −$1,965 | −$1,965 |
| HOA per listing | −$0 | −$0 |
| Total operating costs and reserves | −$16,668 | −$17,268 |
| MODELED NOI | $27,518 | $31,444 |
| Cap rate at HUD asking price | 7.00% | 8.00% |
NOI includes an analytical replacement reserve for conservative modeling; lenders and appraisers may use different standardized definitions. Costs grow with rent only where explicitly modeled below; taxes and insurance are held at the initial price proxy for this working model.
04 · Financing & Capital Required — Investor
Illustrative financing assumes 25% down, 75% loan-to-value, fixed 8.00% annual interest and 30-year amortization. This is not a current lender quote. Investment property financing eligibility, DSCR loan sizing, property type restrictions, credit underwriting and insurance may invalidate this structure.
| Financing item | Modeled amount |
|---|---|
| Purchase price | $393,000 |
| 25% investor down payment | $98,250 |
| Illustrative first mortgage | $294,750 |
| Estimated closing cost at 3% | $11,790 |
| Total initial cash requirement before repairs/reserves | $110,040 |
| Monthly principal & interest at assumed 8% | $2,163 |
| Annual debt service | $25,953 |
| NOI / debt service (7% reverse scenario) | 1.06× |
| Year-one pre-tax cash flow at reverse rent | $1,565 |
| Year-one cash-on-cash on modeled initial cash | 1.42% |
05 · Owner-Occupant and Rehabilitation Path
If a qualified buyer intends to occupy the property, an FHA 203(k) rehabilitation mortgage may be relevant depending on appraisal, condition, eligibility and lender requirements. The arithmetic below uses a simplified 3.5% minimum-equity illustration on the asking price before a verified rehabilitation budget. Financing of improvements, contingencies, financeable fees, limits and valuation is lender-specific.
| Owner-occupant illustration | Before rehab |
|---|---|
| Acquisition price | $393,000 |
| Illustrative 3.5% down on price | $13,755 |
| Base loan before financed fees or repairs | $379,245 |
| Illustrative P&I at an assumed 7% / 30 years | $2,523/month |
| Mortgage insurance, property tax, HOA, homeowners insurance | Not included |
| Contractor bid, contingency, feasibility review | Required |
| FHA renovation total and actual 3.5% cash | Not established |
HUD classification review: HUD class IE: listing classification is not an FHA commitment; appraisal, property condition, rehabilitation scope and underwriting govern.
For an owner-occupant example with verified repairs B, an initial 3.5% illustration is 0.035 × (HUD purchase price + eligible financed rehabilitation costs B), subject to the maximum-mortgage and 203(k) calculations. This is not a statement that every repair dollar is financeable.
06 · Ten-Year Income, Debt and Equity Model
This sensitivity model begins with the required 7% rent—again, a hypothetical threshold, not observed rent—and assumes 3% annual rent growth. It holds fixed price-linked operating expense proxies constant and applies management/reserves to growing rent. The fixed-rate 8% mortgage amortizes over 30 years. Repairs, special assessments, tax reassessments, depreciation, income taxes, rent-control restrictions and major capital events are excluded. The model is not a forecast.
| Year | Monthly rent | NOI | Debt service | Pre-tax cash flow | Loan balance |
|---|---|---|---|---|---|
| Year 1 | $3,876 | $27,518 | $25,953 | $1,565 | $292,288 |
| Year 2 | $3,992 | $28,668 | $25,953 | $2,715 | $289,621 |
| Year 3 | $4,112 | $29,852 | $25,953 | $3,899 | $286,733 |
| Year 4 | $4,235 | $31,072 | $25,953 | $5,119 | $283,606 |
| Year 5 | $4,362 | $32,329 | $25,953 | $6,375 | $280,218 |
| Year 6 | $4,493 | $33,623 | $25,953 | $7,669 | $276,550 |
| Year 7 | $4,628 | $34,956 | $25,953 | $9,002 | $272,577 |
| Year 8 | $4,767 | $36,329 | $25,953 | $10,375 | $268,275 |
| Year 9 | $4,910 | $37,743 | $25,953 | $11,789 | $263,615 |
| Year 10 | $5,057 | $39,199 | $25,953 | $13,246 | $258,569 |
At year ten, scheduled monthly rent would be $5,057 and NOI $39,199, conditional on uninterrupted growth and the initial unverified rent assumption. Cumulative ten-year pre-tax operating cash flow is $71,756 before exit.
07 · Exit Analysis and Sensitivity
At a hypothetical 7.50% terminal cap rate, the year-ten NOI produces a gross exit valuation of $522,655. After assumed 6% selling expenses and debt payoff, the sale would return approximately $232,727 before tax and any unmodeled capital costs. The ten-year illustrative internal rate of return (IRR) is 11.86%, calculated using modeled initial cash, ten annual cash flows and net year-ten sale proceeds. This value is highly sensitive to achievable rents, terminal cap rates and actual property condition.
Ten-year illustrative IRR: rent-growth / exit-cap sensitivity
| Annual rent growth | 6.50% exit cap | 7.50% exit cap | 8.50% exit cap |
|---|---|---|---|
| 1.00% | 7.92% | 4.48% | 0.86% |
| 3.00% | 14.40% | 11.86% | 9.46% |
| 5.00% | 19.49% | 17.35% | 15.42% |
The table is a genuine 10-year cash-flow IRR calculation on the hypothetical reverse-underwriting starting rent. It is not a market-supported expected return. It excludes tax, material repairs, special assessments, insurance spikes and other due-diligence unknowns.
08 · Market, Condition and Compliance Review
Market rent comparables
Unverified. Obtain at least three currently available or recently leased comparable homes, with addresses, bedroom count, condition, date, source, asking versus achieved rent, and documented adjustments.
Condition and capital work
Unverified. Review the HUD property-condition report, addenda, utilities, pest, roof, HVAC, foundation and occupancy, then obtain scope-specific contractor bids and a contingency allowance.
Property operating data
Unverified. Retrieve county tax record, homeowner/hazard insurance quote, actual HOA dues and rental restrictions, municipal license requirements, utilities and property management proposals.
Regulatory review
Unverified. Confirm county/city rent regulation, AB 1482 applicability and exemptions, short-term rental restrictions, local safety and occupancy rules, and HUD bidding eligibility.
09 · Sources, Limitations and Editorial Decision
HUD Home Store — Case 194-223999 (primary source) · HUD property flyer · Official HUD inventory
HUD properties may be placed under contract or sold between editorial preparation and reader access. Readers must confirm current status, eligibility, bid periods, fees, disclosures and price at the source immediately before action. Your Power Is Now to act—but only on verified information.
This independent educational analysis is not a HUD publication, appraisal, broker price opinion, financing commitment or assurance of investment return. All target-rent scenarios, modeled costs, rates, projections and valuations are explicitly hypothetical. This research draft should not be inserted into a member issue without source evidence, final arithmetic verification and author approval.
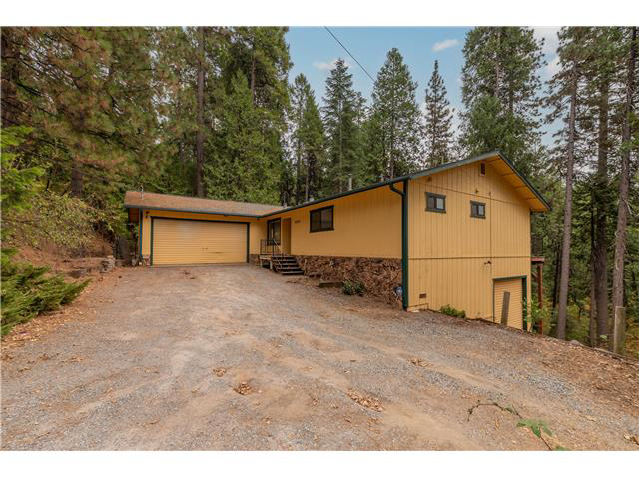
4250 Kingswood Trl
Pollock Pines, CA 95726
$386,000 asking
At the asking price
$2,574/mo gross rent for an 8% gross yield
$23,160/yr NOI for a 6% cap rate
$30,880/yr NOI for an 8% cap rate
Illustrative Deal Analyzer · 4250 Kingswood Trl
Educational scenarios, not a rent appraisal, lender quote, repair bid, or offer recommendation. Asking price is from the displayed HUD listing snapshot; every other amount below is a modeling assumption. Confirm listing status and bidding rules with HUD.
Investor scenario · 7% and 8% cap-rate illustrations
Expenses: 1.2% of asking for property tax; 0.5% for insurance; 5% of gross rent for vacancy; 8% maintenance; 8% management; 5% capital reserves; 3% miscellaneous. Cap-rate prices equal modeled NOI divided by 0.07 or 0.08. Financing and acquisition costs are excluded from cap-rate calculations.
Investor financing illustration
Financing assumes purchase at the displayed asking price. Cash flow excludes closing costs, points, taxes on investor income, and property-specific unexpected repairs. Lending terms and qualification differ by borrower.
Owner-occupant purchase and renovation illustration
A possible FHA 203(k) renovation illustration only. Actual eligible acquisition and repair amounts, the financed base, minimum investment, mortgage insurance, escrow, interest rate, closing costs, contractor bids and lender approval must be determined separately. The repair allowance is a placeholder, not an estimate of the property’s condition.
Before deciding: Confirm allowable HUD bidder category and bid deadline; obtain current rent comparables, condition report, insurance and tax quotes, inspection and renovation bids, and written financing terms. Check HUD case 049-185779.
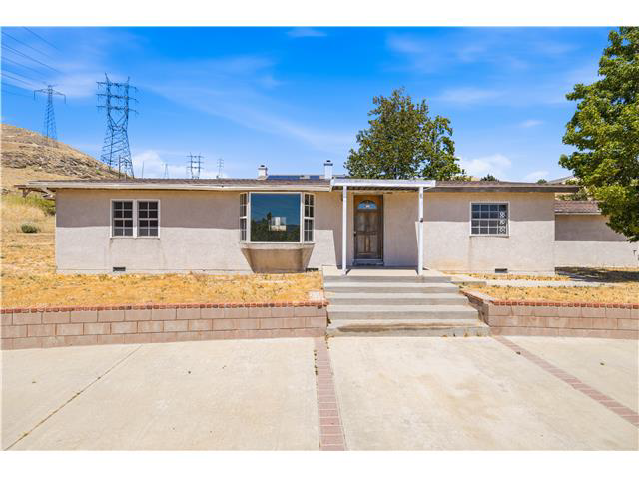
42871 Leadhill Dr
Lake Hughes, CA 93532
$385,000 asking
At the asking price
$2,567/mo gross rent for an 8% gross yield
$23,100/yr NOI for a 6% cap rate
$30,800/yr NOI for an 8% cap rate
Illustrative Deal Analyzer · 42871 Leadhill Dr
Educational scenarios, not a rent appraisal, lender quote, repair bid, or offer recommendation. Asking price is from the displayed HUD listing snapshot; every other amount below is a modeling assumption. Confirm listing status and bidding rules with HUD.
Investor scenario · 7% and 8% cap-rate illustrations
Expenses: 1.2% of asking for property tax; 0.5% for insurance; 5% of gross rent for vacancy; 8% maintenance; 8% management; 5% capital reserves; 3% miscellaneous. Cap-rate prices equal modeled NOI divided by 0.07 or 0.08. Financing and acquisition costs are excluded from cap-rate calculations.
Investor financing illustration
Financing assumes purchase at the displayed asking price. Cash flow excludes closing costs, points, taxes on investor income, and property-specific unexpected repairs. Lending terms and qualification differ by borrower.
Owner-occupant purchase and renovation illustration
A possible FHA 203(k) renovation illustration only. Actual eligible acquisition and repair amounts, the financed base, minimum investment, mortgage insurance, escrow, interest rate, closing costs, contractor bids and lender approval must be determined separately. The repair allowance is a placeholder, not an estimate of the property’s condition.
Before deciding: Confirm allowable HUD bidder category and bid deadline; obtain current rent comparables, condition report, insurance and tax quotes, inspection and renovation bids, and written financing terms. Check HUD case 197-354117.
Investment Property Analysis
42871 Leadhill Dr, Lake Hughes, California · HUD Case 197-354117
ILLUSTRATIVE INVESTMENT ANALYSISPrepared November 16, 2026 · Eric Lawrence Frazier, MBA · DRE 01143484 · NMLS 461807
01 · Acquisition Summary & Investment Decision
The HUD asking price is $385,000. This report evaluates whether the property could support a 7% or 8% capitalization-rate investment and separately describes an owner-occupant purchase. The available source does not establish obtainable rent, condition-adjusted value, contractor costs, insurability or lender eligibility. Consequently, an investment purchase recommendation is withheld pending diligence, not converted from hypothetical rents into a false offer.
Property facts
Single Family Home; 3 bedrooms, 2 baths, 1179 square feet. HOA: $0 monthly. HUD financing classification: IE.
Investor rental restrictions, HOA disclosures, property damage and occupancy have not been independently reviewed.
Evidence classification
HUD listing data Prior official page check for the values shown; current marketability requires recheck.
Modeled assumptions All rents and expense percentages in this report are sensitivity illustrations, not property-specific comps or bids.
02 · Investor Underwriting Method and Required Rent
These are reverse-underwriting scenarios: they calculate the monthly rent the listing would need to justify the asking price at target capitalization rates. They do not claim those rents can be collected. A local market-rent study, unit condition and rental restrictions must determine the actual rent input.
| Measure | 7% target scenario | 8% target scenario |
|---|---|---|
| Required monthly rent | $3,797 | $4,186 |
| Required annual scheduled rent | $45,564 | $50,232 |
| Annual NOI at that hypothetical rent | $26,957 | $30,804 |
| Target yield | 7.00% | 8.00% |
| Monthly rent as % of listing price | 0.99% | 1.09% |
03 · Operating Statement — Year One
Property-specific accounting: 5% vacancy, management equal to 8% of effective income, annual replacement reserve at 5% of gross rents, 1% of asking price for ordinary maintenance, 1.25% tax, 0.5% insurance, and the indicated HOA fee. These are underwriting inputs only; none substitutes for tax records, insurance quotation or service contracts.
| Income / expense line | 7% reverse scenario | 8% reverse scenario |
|---|---|---|
| Gross scheduled rent · threshold assumption | $45,564 | $50,232 |
| Vacancy/credit loss (5%) | −$2,278 | −$2,512 |
| Effective gross income | $43,286 | $47,720 |
| Management (8% of effective income) | −$3,463 | −$3,818 |
| Replacement reserve (5% gross) | −$2,278 | −$2,512 |
| Maintenance reserve (1% price) | −$3,850 | −$3,850 |
| Illustrative tax (1.25% price) | −$4,813 | −$4,813 |
| Illustrative insurance (0.5% price) | −$1,925 | −$1,925 |
| HOA per listing | −$0 | −$0 |
| Total operating costs and reserves | −$16,329 | −$16,917 |
| MODELED NOI | $26,957 | $30,804 |
| Cap rate at HUD asking price | 7.00% | 8.00% |
NOI includes an analytical replacement reserve for conservative modeling; lenders and appraisers may use different standardized definitions. Costs grow with rent only where explicitly modeled below; taxes and insurance are held at the initial price proxy for this working model.
04 · Financing & Capital Required — Investor
Illustrative financing assumes 25% down, 75% loan-to-value, fixed 8.00% annual interest and 30-year amortization. This is not a current lender quote. Investment property financing eligibility, DSCR loan sizing, property type restrictions, credit underwriting and insurance may invalidate this structure.
| Financing item | Modeled amount |
|---|---|
| Purchase price | $385,000 |
| 25% investor down payment | $96,250 |
| Illustrative first mortgage | $288,750 |
| Estimated closing cost at 3% | $11,550 |
| Total initial cash requirement before repairs/reserves | $107,800 |
| Monthly principal & interest at assumed 8% | $2,119 |
| Annual debt service | $25,425 |
| NOI / debt service (7% reverse scenario) | 1.06× |
| Year-one pre-tax cash flow at reverse rent | $1,532 |
| Year-one cash-on-cash on modeled initial cash | 1.42% |
05 · Owner-Occupant and Rehabilitation Path
If a qualified buyer intends to occupy the property, an FHA 203(k) rehabilitation mortgage may be relevant depending on appraisal, condition, eligibility and lender requirements. The arithmetic below uses a simplified 3.5% minimum-equity illustration on the asking price before a verified rehabilitation budget. Financing of improvements, contingencies, financeable fees, limits and valuation is lender-specific.
| Owner-occupant illustration | Before rehab |
|---|---|
| Acquisition price | $385,000 |
| Illustrative 3.5% down on price | $13,475 |
| Base loan before financed fees or repairs | $371,525 |
| Illustrative P&I at an assumed 7% / 30 years | $2,472/month |
| Mortgage insurance, property tax, HOA, homeowners insurance | Not included |
| Contractor bid, contingency, feasibility review | Required |
| FHA renovation total and actual 3.5% cash | Not established |
HUD classification review: HUD class IE: listing classification is not an FHA commitment; appraisal, property condition, rehabilitation scope and underwriting govern.
For an owner-occupant example with verified repairs B, an initial 3.5% illustration is 0.035 × (HUD purchase price + eligible financed rehabilitation costs B), subject to the maximum-mortgage and 203(k) calculations. This is not a statement that every repair dollar is financeable.
06 · Ten-Year Income, Debt and Equity Model
This sensitivity model begins with the required 7% rent—again, a hypothetical threshold, not observed rent—and assumes 3% annual rent growth. It holds fixed price-linked operating expense proxies constant and applies management/reserves to growing rent. The fixed-rate 8% mortgage amortizes over 30 years. Repairs, special assessments, tax reassessments, depreciation, income taxes, rent-control restrictions and major capital events are excluded. The model is not a forecast.
| Year | Monthly rent | NOI | Debt service | Pre-tax cash flow | Loan balance |
|---|---|---|---|---|---|
| Year 1 | $3,797 | $26,957 | $25,425 | $1,532 | $286,338 |
| Year 2 | $3,911 | $28,084 | $25,425 | $2,659 | $283,726 |
| Year 3 | $4,028 | $29,244 | $25,425 | $3,819 | $280,896 |
| Year 4 | $4,149 | $30,439 | $25,425 | $5,014 | $277,832 |
| Year 5 | $4,274 | $31,669 | $25,425 | $6,244 | $274,514 |
| Year 6 | $4,402 | $32,937 | $25,425 | $7,512 | $270,921 |
| Year 7 | $4,534 | $34,243 | $25,425 | $8,818 | $267,029 |
| Year 8 | $4,670 | $35,588 | $25,425 | $10,163 | $262,814 |
| Year 9 | $4,810 | $36,973 | $25,425 | $11,548 | $258,249 |
| Year 10 | $4,954 | $38,400 | $25,425 | $12,975 | $253,305 |
At year ten, scheduled monthly rent would be $4,954 and NOI $38,400, conditional on uninterrupted growth and the initial unverified rent assumption. Cumulative ten-year pre-tax operating cash flow is $70,284 before exit.
07 · Exit Analysis and Sensitivity
At a hypothetical 7.50% terminal cap rate, the year-ten NOI produces a gross exit valuation of $511,998. After assumed 6% selling expenses and debt payoff, the sale would return approximately $227,973 before tax and any unmodeled capital costs. The ten-year illustrative internal rate of return (IRR) is 11.86%, calculated using modeled initial cash, ten annual cash flows and net year-ten sale proceeds. This value is highly sensitive to achievable rents, terminal cap rates and actual property condition.
Ten-year illustrative IRR: rent-growth / exit-cap sensitivity
| Annual rent growth | 6.50% exit cap | 7.50% exit cap | 8.50% exit cap |
|---|---|---|---|
| 1.00% | 7.92% | 4.48% | 0.86% |
| 3.00% | 14.40% | 11.86% | 9.45% |
| 5.00% | 19.49% | 17.35% | 15.42% |
The table is a genuine 10-year cash-flow IRR calculation on the hypothetical reverse-underwriting starting rent. It is not a market-supported expected return. It excludes tax, material repairs, special assessments, insurance spikes and other due-diligence unknowns.
08 · Market, Condition and Compliance Review
Market rent comparables
Unverified. Obtain at least three currently available or recently leased comparable homes, with addresses, bedroom count, condition, date, source, asking versus achieved rent, and documented adjustments.
Condition and capital work
Unverified. Review the HUD property-condition report, addenda, utilities, pest, roof, HVAC, foundation and occupancy, then obtain scope-specific contractor bids and a contingency allowance.
Property operating data
Unverified. Retrieve county tax record, homeowner/hazard insurance quote, actual HOA dues and rental restrictions, municipal license requirements, utilities and property management proposals.
Regulatory review
Unverified. Confirm county/city rent regulation, AB 1482 applicability and exemptions, short-term rental restrictions, local safety and occupancy rules, and HUD bidding eligibility.
09 · Sources, Limitations and Editorial Decision
HUD Home Store — Case 197-354117 (primary source) · HUD property flyer · Official HUD inventory
HUD properties may be placed under contract or sold between editorial preparation and reader access. Readers must confirm current status, eligibility, bid periods, fees, disclosures and price at the source immediately before action. Your Power Is Now to act—but only on verified information.
This independent educational analysis is not a HUD publication, appraisal, broker price opinion, financing commitment or assurance of investment return. All target-rent scenarios, modeled costs, rates, projections and valuations are explicitly hypothetical. This research draft should not be inserted into a member issue without source evidence, final arithmetic verification and author approval.
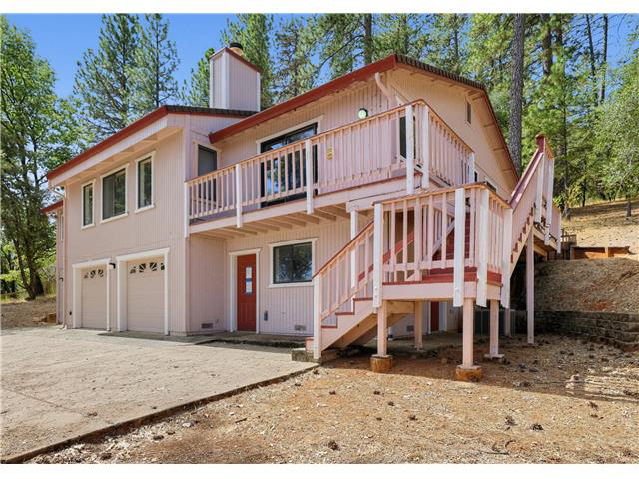
2603 Cascade Trail
Cool, CA 95614
$378,000 asking
At the asking price
$2,520/mo gross rent for an 8% gross yield
$22,680/yr NOI for a 6% cap rate
$30,240/yr NOI for an 8% cap rate
Illustrative Deal Analyzer · 2603 Cascade Trail
Educational scenarios, not a rent appraisal, lender quote, repair bid, or offer recommendation. Asking price is from the displayed HUD listing snapshot; every other amount below is a modeling assumption. Confirm listing status and bidding rules with HUD.
Investor scenario · 7% and 8% cap-rate illustrations
Expenses: 1.2% of asking for property tax; 0.5% for insurance; 5% of gross rent for vacancy; 8% maintenance; 8% management; 5% capital reserves; 3% miscellaneous. Cap-rate prices equal modeled NOI divided by 0.07 or 0.08. Financing and acquisition costs are excluded from cap-rate calculations.
Investor financing illustration
Financing assumes purchase at the displayed asking price. Cash flow excludes closing costs, points, taxes on investor income, and property-specific unexpected repairs. Lending terms and qualification differ by borrower.
Owner-occupant purchase and renovation illustration
A possible FHA 203(k) renovation illustration only. Actual eligible acquisition and repair amounts, the financed base, minimum investment, mortgage insurance, escrow, interest rate, closing costs, contractor bids and lender approval must be determined separately. The repair allowance is a placeholder, not an estimate of the property’s condition.
Before deciding: Confirm allowable HUD bidder category and bid deadline; obtain current rent comparables, condition report, insurance and tax quotes, inspection and renovation bids, and written financing terms. Check HUD case 049-189362.
Investment Property Analysis
2603 Cascade Trail, Cool, California · HUD Case 049-189362
ILLUSTRATIVE INVESTMENT ANALYSISPrepared November 16, 2026 · Eric Lawrence Frazier, MBA · DRE 01143484 · NMLS 461807
01 · Acquisition Summary & Investment Decision
The HUD asking price is $378,000. This report evaluates whether the property could support a 7% or 8% capitalization-rate investment and separately describes an owner-occupant purchase. The available source does not establish obtainable rent, condition-adjusted value, contractor costs, insurability or lender eligibility. Consequently, an investment purchase recommendation is withheld pending diligence, not converted from hypothetical rents into a false offer.
Property facts
Single Family Home; 3 bedrooms, 2 baths, 1983 square feet. HOA: $244 monthly. HUD financing classification: IE.
Investor rental restrictions, HOA disclosures, property damage and occupancy have not been independently reviewed.
Evidence classification
HUD listing data Prior official page check for the values shown; current marketability requires recheck.
Modeled assumptions All rents and expense percentages in this report are sensitivity illustrations, not property-specific comps or bids.
02 · Investor Underwriting Method and Required Rent
These are reverse-underwriting scenarios: they calculate the monthly rent the listing would need to justify the asking price at target capitalization rates. They do not claim those rents can be collected. A local market-rent study, unit condition and rental restrictions must determine the actual rent input.
| Measure | 7% target scenario | 8% target scenario |
|---|---|---|
| Required monthly rent | $4,024 | $4,406 |
| Required annual scheduled rent | $48,288 | $52,872 |
| Annual NOI at that hypothetical rent | $26,466 | $30,244 |
| Target yield | 7.00% | 8.00% |
| Monthly rent as % of listing price | 1.06% | 1.17% |
03 · Operating Statement — Year One
Property-specific accounting: 5% vacancy, management equal to 8% of effective income, annual replacement reserve at 5% of gross rents, 1% of asking price for ordinary maintenance, 1.25% tax, 0.5% insurance, and the indicated HOA fee. These are underwriting inputs only; none substitutes for tax records, insurance quotation or service contracts.
| Income / expense line | 7% reverse scenario | 8% reverse scenario |
|---|---|---|
| Gross scheduled rent · threshold assumption | $48,288 | $52,872 |
| Vacancy/credit loss (5%) | −$2,414 | −$2,644 |
| Effective gross income | $45,874 | $50,228 |
| Management (8% of effective income) | −$3,670 | −$4,018 |
| Replacement reserve (5% gross) | −$2,414 | −$2,644 |
| Maintenance reserve (1% price) | −$3,780 | −$3,780 |
| Illustrative tax (1.25% price) | −$4,725 | −$4,725 |
| Illustrative insurance (0.5% price) | −$1,890 | −$1,890 |
| HOA per listing | −$2,928 | −$2,928 |
| Total operating costs and reserves | −$19,407 | −$19,985 |
| MODELED NOI | $26,466 | $30,244 |
| Cap rate at HUD asking price | 7.00% | 8.00% |
NOI includes an analytical replacement reserve for conservative modeling; lenders and appraisers may use different standardized definitions. Costs grow with rent only where explicitly modeled below; taxes and insurance are held at the initial price proxy for this working model.
04 · Financing & Capital Required — Investor
Illustrative financing assumes 25% down, 75% loan-to-value, fixed 8.00% annual interest and 30-year amortization. This is not a current lender quote. Investment property financing eligibility, DSCR loan sizing, property type restrictions, credit underwriting and insurance may invalidate this structure.
| Financing item | Modeled amount |
|---|---|
| Purchase price | $378,000 |
| 25% investor down payment | $94,500 |
| Illustrative first mortgage | $283,500 |
| Estimated closing cost at 3% | $11,340 |
| Total initial cash requirement before repairs/reserves | $105,840 |
| Monthly principal & interest at assumed 8% | $2,080 |
| Annual debt service | $24,963 |
| NOI / debt service (7% reverse scenario) | 1.06× |
| Year-one pre-tax cash flow at reverse rent | $1,504 |
| Year-one cash-on-cash on modeled initial cash | 1.42% |
05 · Owner-Occupant and Rehabilitation Path
If a qualified buyer intends to occupy the property, an FHA 203(k) rehabilitation mortgage may be relevant depending on appraisal, condition, eligibility and lender requirements. The arithmetic below uses a simplified 3.5% minimum-equity illustration on the asking price before a verified rehabilitation budget. Financing of improvements, contingencies, financeable fees, limits and valuation is lender-specific.
| Owner-occupant illustration | Before rehab |
|---|---|
| Acquisition price | $378,000 |
| Illustrative 3.5% down on price | $13,230 |
| Base loan before financed fees or repairs | $364,770 |
| Illustrative P&I at an assumed 7% / 30 years | $2,427/month |
| Mortgage insurance, property tax, HOA, homeowners insurance | Not included |
| Contractor bid, contingency, feasibility review | Required |
| FHA renovation total and actual 3.5% cash | Not established |
HUD classification review: HUD class IE: listing classification is not an FHA commitment; appraisal, property condition, rehabilitation scope and underwriting govern.
For an owner-occupant example with verified repairs B, an initial 3.5% illustration is 0.035 × (HUD purchase price + eligible financed rehabilitation costs B), subject to the maximum-mortgage and 203(k) calculations. This is not a statement that every repair dollar is financeable.
06 · Ten-Year Income, Debt and Equity Model
This sensitivity model begins with the required 7% rent—again, a hypothetical threshold, not observed rent—and assumes 3% annual rent growth. It holds fixed price-linked operating expense proxies constant and applies management/reserves to growing rent. The fixed-rate 8% mortgage amortizes over 30 years. Repairs, special assessments, tax reassessments, depreciation, income taxes, rent-control restrictions and major capital events are excluded. The model is not a forecast.
| Year | Monthly rent | NOI | Debt service | Pre-tax cash flow | Loan balance |
|---|---|---|---|---|---|
| Year 1 | $4,024 | $26,466 | $24,963 | $1,504 | $281,132 |
| Year 2 | $4,145 | $27,660 | $24,963 | $2,697 | $278,567 |
| Year 3 | $4,269 | $28,889 | $24,963 | $3,927 | $275,789 |
| Year 4 | $4,397 | $30,156 | $24,963 | $5,193 | $272,781 |
| Year 5 | $4,529 | $31,460 | $24,963 | $6,498 | $269,523 |
| Year 6 | $4,665 | $32,804 | $24,963 | $7,841 | $265,995 |
| Year 7 | $4,805 | $34,188 | $24,963 | $9,225 | $262,174 |
| Year 8 | $4,949 | $35,613 | $24,963 | $10,650 | $258,035 |
| Year 9 | $5,097 | $37,081 | $24,963 | $12,118 | $253,553 |
| Year 10 | $5,250 | $38,593 | $24,963 | $13,630 | $248,700 |
At year ten, scheduled monthly rent would be $5,250 and NOI $38,593, conditional on uninterrupted growth and the initial unverified rent assumption. Cumulative ten-year pre-tax operating cash flow is $73,283 before exit.
07 · Exit Analysis and Sensitivity
At a hypothetical 7.50% terminal cap rate, the year-ten NOI produces a gross exit valuation of $514,574. After assumed 6% selling expenses and debt payoff, the sale would return approximately $235,000 before tax and any unmodeled capital costs. The ten-year illustrative internal rate of return (IRR) is 12.51%, calculated using modeled initial cash, ten annual cash flows and net year-ten sale proceeds. This value is highly sensitive to achievable rents, terminal cap rates and actual property condition.
Ten-year illustrative IRR: rent-growth / exit-cap sensitivity
| Annual rent growth | 6.50% exit cap | 7.50% exit cap | 8.50% exit cap |
|---|---|---|---|
| 1.00% | 8.21% | 4.82% | 1.28% |
| 3.00% | 14.99% | 12.51% | 10.17% |
| 5.00% | 20.26% | 18.17% | 16.29% |
The table is a genuine 10-year cash-flow IRR calculation on the hypothetical reverse-underwriting starting rent. It is not a market-supported expected return. It excludes tax, material repairs, special assessments, insurance spikes and other due-diligence unknowns.
08 · Market, Condition and Compliance Review
Market rent comparables
Unverified. Obtain at least three currently available or recently leased comparable homes, with addresses, bedroom count, condition, date, source, asking versus achieved rent, and documented adjustments.
Condition and capital work
Unverified. Review the HUD property-condition report, addenda, utilities, pest, roof, HVAC, foundation and occupancy, then obtain scope-specific contractor bids and a contingency allowance.
Property operating data
Unverified. Retrieve county tax record, homeowner/hazard insurance quote, actual HOA dues and rental restrictions, municipal license requirements, utilities and property management proposals.
Regulatory review
Unverified. Confirm county/city rent regulation, AB 1482 applicability and exemptions, short-term rental restrictions, local safety and occupancy rules, and HUD bidding eligibility.
09 · Sources, Limitations and Editorial Decision
HUD Home Store — Case 049-189362 (primary source) · HUD property flyer · Official HUD inventory
HUD properties may be placed under contract or sold between editorial preparation and reader access. Readers must confirm current status, eligibility, bid periods, fees, disclosures and price at the source immediately before action. Your Power Is Now to act—but only on verified information.
This independent educational analysis is not a HUD publication, appraisal, broker price opinion, financing commitment or assurance of investment return. All target-rent scenarios, modeled costs, rates, projections and valuations are explicitly hypothetical. This research draft should not be inserted into a member issue without source evidence, final arithmetic verification and author approval.
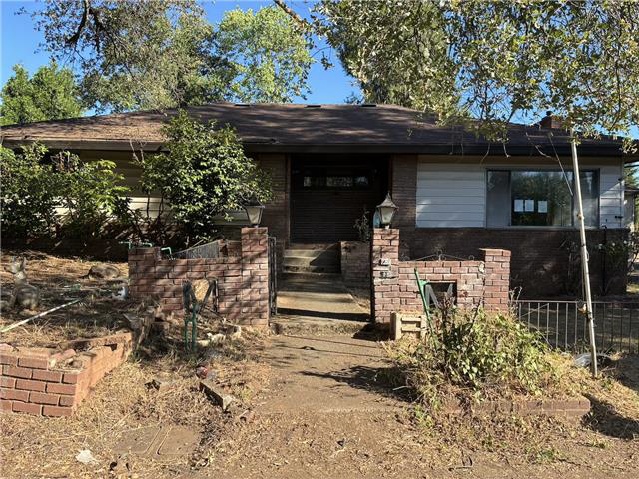
446 Canal St
Placerville, CA 95667
$340,000 asking
At the asking price
$2,267/mo gross rent for an 8% gross yield
$20,400/yr NOI for a 6% cap rate
$27,200/yr NOI for an 8% cap rate
Illustrative Deal Analyzer · 446 Canal St
Educational scenarios, not a rent appraisal, lender quote, repair bid, or offer recommendation. Asking price is from the displayed HUD listing snapshot; every other amount below is a modeling assumption. Confirm listing status and bidding rules with HUD.
Investor scenario · 7% and 8% cap-rate illustrations
Expenses: 1.2% of asking for property tax; 0.5% for insurance; 5% of gross rent for vacancy; 8% maintenance; 8% management; 5% capital reserves; 3% miscellaneous. Cap-rate prices equal modeled NOI divided by 0.07 or 0.08. Financing and acquisition costs are excluded from cap-rate calculations.
Investor financing illustration
Financing assumes purchase at the displayed asking price. Cash flow excludes closing costs, points, taxes on investor income, and property-specific unexpected repairs. Lending terms and qualification differ by borrower.
Owner-occupant purchase and renovation illustration
A possible FHA 203(k) renovation illustration only. Actual eligible acquisition and repair amounts, the financed base, minimum investment, mortgage insurance, escrow, interest rate, closing costs, contractor bids and lender approval must be determined separately. The repair allowance is a placeholder, not an estimate of the property’s condition.
Before deciding: Confirm allowable HUD bidder category and bid deadline; obtain current rent comparables, condition report, insurance and tax quotes, inspection and renovation bids, and written financing terms. Check HUD case 043-742282.
Investment Property Analysis
446 Canal St, Placerville, California · HUD Case 043-742282
ILLUSTRATIVE INVESTMENT ANALYSISPrepared November 16, 2026 · Eric Lawrence Frazier, MBA · DRE 01143484 · NMLS 461807
01 · Acquisition Summary & Investment Decision
The HUD asking price is $340,000. This report evaluates whether the property could support a 7% or 8% capitalization-rate investment and separately describes an owner-occupant purchase. The available source does not establish obtainable rent, condition-adjusted value, contractor costs, insurability or lender eligibility. Consequently, an investment purchase recommendation is withheld pending diligence, not converted from hypothetical rents into a false offer.
Property facts
Single Family Home; 4 bedrooms, 2 baths, 1714 square feet. HOA: $0 monthly. HUD financing classification: UI.
Investor rental restrictions, HOA disclosures, property damage and occupancy have not been independently reviewed.
Evidence classification
HUD listing data Prior official page check for the values shown; current marketability requires recheck.
Modeled assumptions All rents and expense percentages in this report are sensitivity illustrations, not property-specific comps or bids.
02 · Investor Underwriting Method and Required Rent
These are reverse-underwriting scenarios: they calculate the monthly rent the listing would need to justify the asking price at target capitalization rates. They do not claim those rents can be collected. A local market-rent study, unit condition and rental restrictions must determine the actual rent input.
| Measure | 7% target scenario | 8% target scenario |
|---|---|---|
| Required monthly rent | $3,353 | $3,697 |
| Required annual scheduled rent | $40,236 | $44,364 |
| Annual NOI at that hypothetical rent | $23,804 | $27,206 |
| Target yield | 7.00% | 8.00% |
| Monthly rent as % of listing price | 0.99% | 1.09% |
03 · Operating Statement — Year One
Property-specific accounting: 5% vacancy, management equal to 8% of effective income, annual replacement reserve at 5% of gross rents, 1% of asking price for ordinary maintenance, 1.25% tax, 0.5% insurance, and the indicated HOA fee. These are underwriting inputs only; none substitutes for tax records, insurance quotation or service contracts.
| Income / expense line | 7% reverse scenario | 8% reverse scenario |
|---|---|---|
| Gross scheduled rent · threshold assumption | $40,236 | $44,364 |
| Vacancy/credit loss (5%) | −$2,012 | −$2,218 |
| Effective gross income | $38,224 | $42,146 |
| Management (8% of effective income) | −$3,058 | −$3,372 |
| Replacement reserve (5% gross) | −$2,012 | −$2,218 |
| Maintenance reserve (1% price) | −$3,400 | −$3,400 |
| Illustrative tax (1.25% price) | −$4,250 | −$4,250 |
| Illustrative insurance (0.5% price) | −$1,700 | −$1,700 |
| HOA per listing | −$0 | −$0 |
| Total operating costs and reserves | −$14,420 | −$14,940 |
| MODELED NOI | $23,804 | $27,206 |
| Cap rate at HUD asking price | 7.00% | 8.00% |
NOI includes an analytical replacement reserve for conservative modeling; lenders and appraisers may use different standardized definitions. Costs grow with rent only where explicitly modeled below; taxes and insurance are held at the initial price proxy for this working model.
04 · Financing & Capital Required — Investor
Illustrative financing assumes 25% down, 75% loan-to-value, fixed 8.00% annual interest and 30-year amortization. This is not a current lender quote. Investment property financing eligibility, DSCR loan sizing, property type restrictions, credit underwriting and insurance may invalidate this structure.
| Financing item | Modeled amount |
|---|---|
| Purchase price | $340,000 |
| 25% investor down payment | $85,000 |
| Illustrative first mortgage | $255,000 |
| Estimated closing cost at 3% | $10,200 |
| Total initial cash requirement before repairs/reserves | $95,200 |
| Monthly principal & interest at assumed 8% | $1,871 |
| Annual debt service | $22,453 |
| NOI / debt service (7% reverse scenario) | 1.06× |
| Year-one pre-tax cash flow at reverse rent | $1,351 |
| Year-one cash-on-cash on modeled initial cash | 1.42% |
05 · Owner-Occupant and Rehabilitation Path
If a qualified buyer intends to occupy the property, an FHA 203(k) rehabilitation mortgage may be relevant depending on appraisal, condition, eligibility and lender requirements. The arithmetic below uses a simplified 3.5% minimum-equity illustration on the asking price before a verified rehabilitation budget. Financing of improvements, contingencies, financeable fees, limits and valuation is lender-specific.
| Owner-occupant illustration | Before rehab |
|---|---|
| Acquisition price | $340,000 |
| Illustrative 3.5% down on price | $11,900 |
| Base loan before financed fees or repairs | $328,100 |
| Illustrative P&I at an assumed 7% / 30 years | $2,183/month |
| Mortgage insurance, property tax, HOA, homeowners insurance | Not included |
| Contractor bid, contingency, feasibility review | Required |
| FHA renovation total and actual 3.5% cash | Not established |
HUD classification review: HUD class UI: conventional insured FHA purchase eligibility must not be assumed; investigate rehabilitation financing and lender/insurer restrictions.
For an owner-occupant example with verified repairs B, an initial 3.5% illustration is 0.035 × (HUD purchase price + eligible financed rehabilitation costs B), subject to the maximum-mortgage and 203(k) calculations. This is not a statement that every repair dollar is financeable.
06 · Ten-Year Income, Debt and Equity Model
This sensitivity model begins with the required 7% rent—again, a hypothetical threshold, not observed rent—and assumes 3% annual rent growth. It holds fixed price-linked operating expense proxies constant and applies management/reserves to growing rent. The fixed-rate 8% mortgage amortizes over 30 years. Repairs, special assessments, tax reassessments, depreciation, income taxes, rent-control restrictions and major capital events are excluded. The model is not a forecast.
| Year | Monthly rent | NOI | Debt service | Pre-tax cash flow | Loan balance |
|---|---|---|---|---|---|
| Year 1 | $3,353 | $23,804 | $22,453 | $1,351 | $252,870 |
| Year 2 | $3,454 | $24,799 | $22,453 | $2,346 | $250,563 |
| Year 3 | $3,557 | $25,824 | $22,453 | $3,370 | $248,064 |
| Year 4 | $3,664 | $26,879 | $22,453 | $4,426 | $245,359 |
| Year 5 | $3,774 | $27,966 | $22,453 | $5,512 | $242,428 |
| Year 6 | $3,887 | $29,085 | $22,453 | $6,632 | $239,254 |
| Year 7 | $4,004 | $30,238 | $22,453 | $7,785 | $235,817 |
| Year 8 | $4,124 | $31,426 | $22,453 | $8,973 | $232,095 |
| Year 9 | $4,247 | $32,649 | $22,453 | $10,196 | $228,064 |
| Year 10 | $4,375 | $33,909 | $22,453 | $11,456 | $223,698 |
At year ten, scheduled monthly rent would be $4,375 and NOI $33,909, conditional on uninterrupted growth and the initial unverified rent assumption. Cumulative ten-year pre-tax operating cash flow is $62,047 before exit.
07 · Exit Analysis and Sensitivity
At a hypothetical 7.50% terminal cap rate, the year-ten NOI produces a gross exit valuation of $452,121. After assumed 6% selling expenses and debt payoff, the sale would return approximately $201,296 before tax and any unmodeled capital costs. The ten-year illustrative internal rate of return (IRR) is 11.85%, calculated using modeled initial cash, ten annual cash flows and net year-ten sale proceeds. This value is highly sensitive to achievable rents, terminal cap rates and actual property condition.
Ten-year illustrative IRR: rent-growth / exit-cap sensitivity
| Annual rent growth | 6.50% exit cap | 7.50% exit cap | 8.50% exit cap |
|---|---|---|---|
| 1.00% | 7.92% | 4.47% | 0.85% |
| 3.00% | 14.39% | 11.85% | 9.45% |
| 5.00% | 19.49% | 17.35% | 15.42% |
The table is a genuine 10-year cash-flow IRR calculation on the hypothetical reverse-underwriting starting rent. It is not a market-supported expected return. It excludes tax, material repairs, special assessments, insurance spikes and other due-diligence unknowns.
08 · Market, Condition and Compliance Review
Market rent comparables
Unverified. Obtain at least three currently available or recently leased comparable homes, with addresses, bedroom count, condition, date, source, asking versus achieved rent, and documented adjustments.
Condition and capital work
Unverified. Review the HUD property-condition report, addenda, utilities, pest, roof, HVAC, foundation and occupancy, then obtain scope-specific contractor bids and a contingency allowance.
Property operating data
Unverified. Retrieve county tax record, homeowner/hazard insurance quote, actual HOA dues and rental restrictions, municipal license requirements, utilities and property management proposals.
Regulatory review
Unverified. Confirm county/city rent regulation, AB 1482 applicability and exemptions, short-term rental restrictions, local safety and occupancy rules, and HUD bidding eligibility.
09 · Sources, Limitations and Editorial Decision
HUD Home Store — Case 043-742282 (primary source) · HUD property flyer · Official HUD inventory
HUD properties may be placed under contract or sold between editorial preparation and reader access. Readers must confirm current status, eligibility, bid periods, fees, disclosures and price at the source immediately before action. Your Power Is Now to act—but only on verified information.
This independent educational analysis is not a HUD publication, appraisal, broker price opinion, financing commitment or assurance of investment return. All target-rent scenarios, modeled costs, rates, projections and valuations are explicitly hypothetical. This research draft should not be inserted into a member issue without source evidence, final arithmetic verification and author approval.
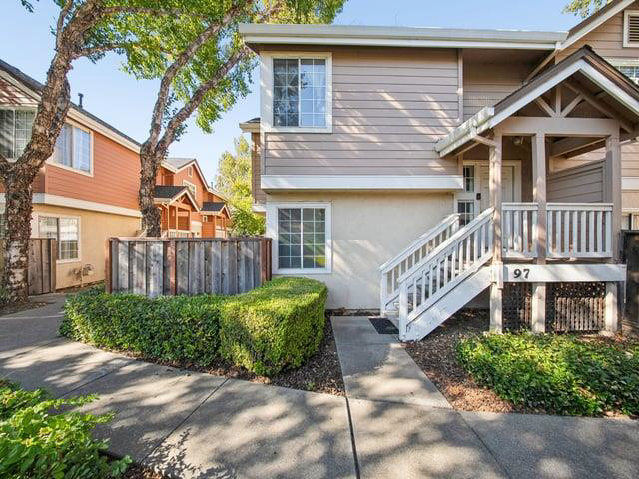
97 Manchester Dr
Fairfield, CA 94533
$330,000 asking
At the asking price
$2,200/mo gross rent for an 8% gross yield
$19,800/yr NOI for a 6% cap rate
$26,400/yr NOI for an 8% cap rate
Illustrative Deal Analyzer · 97 Manchester Dr
Educational scenarios, not a rent appraisal, lender quote, repair bid, or offer recommendation. Asking price is from the displayed HUD listing snapshot; every other amount below is a modeling assumption. Confirm listing status and bidding rules with HUD.
Investor scenario · 7% and 8% cap-rate illustrations
Expenses: 1.2% of asking for property tax; 0.5% for insurance; 5% of gross rent for vacancy; 8% maintenance; 8% management; 5% capital reserves; 3% miscellaneous. Cap-rate prices equal modeled NOI divided by 0.07 or 0.08. Financing and acquisition costs are excluded from cap-rate calculations.
Investor financing illustration
Financing assumes purchase at the displayed asking price. Cash flow excludes closing costs, points, taxes on investor income, and property-specific unexpected repairs. Lending terms and qualification differ by borrower.
Owner-occupant purchase and renovation illustration
A possible FHA 203(k) renovation illustration only. Actual eligible acquisition and repair amounts, the financed base, minimum investment, mortgage insurance, escrow, interest rate, closing costs, contractor bids and lender approval must be determined separately. The repair allowance is a placeholder, not an estimate of the property’s condition.
Before deciding: Confirm allowable HUD bidder category and bid deadline; obtain current rent comparables, condition report, insurance and tax quotes, inspection and renovation bids, and written financing terms. Check HUD case 198-187635.
Investment Property Analysis
97 Manchester Dr, Fairfield, California · HUD Case 198-187635
ILLUSTRATIVE INVESTMENT ANALYSISPrepared November 16, 2026 · Eric Lawrence Frazier, MBA · DRE 01143484 · NMLS 461807
01 · Acquisition Summary & Investment Decision
The HUD asking price is $330,000. This report evaluates whether the property could support a 7% or 8% capitalization-rate investment and separately describes an owner-occupant purchase. The available source does not establish obtainable rent, condition-adjusted value, contractor costs, insurability or lender eligibility. Consequently, an investment purchase recommendation is withheld pending diligence, not converted from hypothetical rents into a false offer.
Property facts
Single Family Home; 2 bedrooms, 1.1 baths, 1034 square feet. HOA: $425 monthly. HUD financing classification: IE.
Investor rental restrictions, HOA disclosures, property damage and occupancy have not been independently reviewed.
Evidence classification
HUD listing data Prior official page check for the values shown; current marketability requires recheck.
Modeled assumptions All rents and expense percentages in this report are sensitivity illustrations, not property-specific comps or bids.
02 · Investor Underwriting Method and Required Rent
These are reverse-underwriting scenarios: they calculate the monthly rent the listing would need to justify the asking price at target capitalization rates. They do not claim those rents can be collected. A local market-rent study, unit condition and rental restrictions must determine the actual rent input.
| Measure | 7% target scenario | 8% target scenario |
|---|---|---|
| Required monthly rent | $3,770 | $4,104 |
| Required annual scheduled rent | $45,240 | $49,248 |
| Annual NOI at that hypothetical rent | $23,103 | $26,405 |
| Target yield | 7.00% | 8.00% |
| Monthly rent as % of listing price | 1.14% | 1.24% |
03 · Operating Statement — Year One
Property-specific accounting: 5% vacancy, management equal to 8% of effective income, annual replacement reserve at 5% of gross rents, 1% of asking price for ordinary maintenance, 1.25% tax, 0.5% insurance, and the indicated HOA fee. These are underwriting inputs only; none substitutes for tax records, insurance quotation or service contracts.
| Income / expense line | 7% reverse scenario | 8% reverse scenario |
|---|---|---|
| Gross scheduled rent · threshold assumption | $45,240 | $49,248 |
| Vacancy/credit loss (5%) | −$2,262 | −$2,462 |
| Effective gross income | $42,978 | $46,786 |
| Management (8% of effective income) | −$3,438 | −$3,743 |
| Replacement reserve (5% gross) | −$2,262 | −$2,462 |
| Maintenance reserve (1% price) | −$3,300 | −$3,300 |
| Illustrative tax (1.25% price) | −$4,125 | −$4,125 |
| Illustrative insurance (0.5% price) | −$1,650 | −$1,650 |
| HOA per listing | −$5,100 | −$5,100 |
| Total operating costs and reserves | −$19,875 | −$20,380 |
| MODELED NOI | $23,103 | $26,405 |
| Cap rate at HUD asking price | 7.00% | 8.00% |
NOI includes an analytical replacement reserve for conservative modeling; lenders and appraisers may use different standardized definitions. Costs grow with rent only where explicitly modeled below; taxes and insurance are held at the initial price proxy for this working model.
04 · Financing & Capital Required — Investor
Illustrative financing assumes 25% down, 75% loan-to-value, fixed 8.00% annual interest and 30-year amortization. This is not a current lender quote. Investment property financing eligibility, DSCR loan sizing, property type restrictions, credit underwriting and insurance may invalidate this structure.
| Financing item | Modeled amount |
|---|---|
| Purchase price | $330,000 |
| 25% investor down payment | $82,500 |
| Illustrative first mortgage | $247,500 |
| Estimated closing cost at 3% | $9,900 |
| Total initial cash requirement before repairs/reserves | $92,400 |
| Monthly principal & interest at assumed 8% | $1,816 |
| Annual debt service | $21,793 |
| NOI / debt service (7% reverse scenario) | 1.06× |
| Year-one pre-tax cash flow at reverse rent | $1,310 |
| Year-one cash-on-cash on modeled initial cash | 1.42% |
05 · Owner-Occupant and Rehabilitation Path
If a qualified buyer intends to occupy the property, an FHA 203(k) rehabilitation mortgage may be relevant depending on appraisal, condition, eligibility and lender requirements. The arithmetic below uses a simplified 3.5% minimum-equity illustration on the asking price before a verified rehabilitation budget. Financing of improvements, contingencies, financeable fees, limits and valuation is lender-specific.
| Owner-occupant illustration | Before rehab |
|---|---|
| Acquisition price | $330,000 |
| Illustrative 3.5% down on price | $11,550 |
| Base loan before financed fees or repairs | $318,450 |
| Illustrative P&I at an assumed 7% / 30 years | $2,119/month |
| Mortgage insurance, property tax, HOA, homeowners insurance | Not included |
| Contractor bid, contingency, feasibility review | Required |
| FHA renovation total and actual 3.5% cash | Not established |
HUD classification review: HUD class IE: listing classification is not an FHA commitment; appraisal, property condition, rehabilitation scope and underwriting govern.
For an owner-occupant example with verified repairs B, an initial 3.5% illustration is 0.035 × (HUD purchase price + eligible financed rehabilitation costs B), subject to the maximum-mortgage and 203(k) calculations. This is not a statement that every repair dollar is financeable.
06 · Ten-Year Income, Debt and Equity Model
This sensitivity model begins with the required 7% rent—again, a hypothetical threshold, not observed rent—and assumes 3% annual rent growth. It holds fixed price-linked operating expense proxies constant and applies management/reserves to growing rent. The fixed-rate 8% mortgage amortizes over 30 years. Repairs, special assessments, tax reassessments, depreciation, income taxes, rent-control restrictions and major capital events are excluded. The model is not a forecast.
| Year | Monthly rent | NOI | Debt service | Pre-tax cash flow | Loan balance |
|---|---|---|---|---|---|
| Year 1 | $3,770 | $23,103 | $21,793 | $1,310 | $245,432 |
| Year 2 | $3,883 | $24,221 | $21,793 | $2,428 | $243,193 |
| Year 3 | $4,000 | $25,373 | $21,793 | $3,580 | $240,768 |
| Year 4 | $4,120 | $26,559 | $21,793 | $4,767 | $238,142 |
| Year 5 | $4,243 | $27,781 | $21,793 | $5,989 | $235,298 |
| Year 6 | $4,370 | $29,040 | $21,793 | $7,247 | $232,218 |
| Year 7 | $4,502 | $30,337 | $21,793 | $8,544 | $228,882 |
| Year 8 | $4,637 | $31,672 | $21,793 | $9,879 | $225,269 |
| Year 9 | $4,776 | $33,047 | $21,793 | $11,255 | $221,356 |
| Year 10 | $4,919 | $34,464 | $21,793 | $12,671 | $217,119 |
At year ten, scheduled monthly rent would be $4,919 and NOI $34,464, conditional on uninterrupted growth and the initial unverified rent assumption. Cumulative ten-year pre-tax operating cash flow is $67,670 before exit.
07 · Exit Analysis and Sensitivity
At a hypothetical 7.50% terminal cap rate, the year-ten NOI produces a gross exit valuation of $459,520. After assumed 6% selling expenses and debt payoff, the sale would return approximately $214,830 before tax and any unmodeled capital costs. The ten-year illustrative internal rate of return (IRR) is 13.13%, calculated using modeled initial cash, ten annual cash flows and net year-ten sale proceeds. This value is highly sensitive to achievable rents, terminal cap rates and actual property condition.
Ten-year illustrative IRR: rent-growth / exit-cap sensitivity
| Annual rent growth | 6.50% exit cap | 7.50% exit cap | 8.50% exit cap |
|---|---|---|---|
| 1.00% | 8.49% | 5.14% | 1.68% |
| 3.00% | 15.56% | 13.13% | 10.86% |
| 5.00% | 20.99% | 18.94% | 17.10% |
The table is a genuine 10-year cash-flow IRR calculation on the hypothetical reverse-underwriting starting rent. It is not a market-supported expected return. It excludes tax, material repairs, special assessments, insurance spikes and other due-diligence unknowns.
08 · Market, Condition and Compliance Review
Market rent comparables
Unverified. Obtain at least three currently available or recently leased comparable homes, with addresses, bedroom count, condition, date, source, asking versus achieved rent, and documented adjustments.
Condition and capital work
Unverified. Review the HUD property-condition report, addenda, utilities, pest, roof, HVAC, foundation and occupancy, then obtain scope-specific contractor bids and a contingency allowance.
Property operating data
Unverified. Retrieve county tax record, homeowner/hazard insurance quote, actual HOA dues and rental restrictions, municipal license requirements, utilities and property management proposals.
Regulatory review
Unverified. Confirm county/city rent regulation, AB 1482 applicability and exemptions, short-term rental restrictions, local safety and occupancy rules, and HUD bidding eligibility.
09 · Sources, Limitations and Editorial Decision
HUD Home Store — Case 198-187635 (primary source) · HUD property flyer · Official HUD inventory
HUD properties may be placed under contract or sold between editorial preparation and reader access. Readers must confirm current status, eligibility, bid periods, fees, disclosures and price at the source immediately before action. Your Power Is Now to act—but only on verified information.
This independent educational analysis is not a HUD publication, appraisal, broker price opinion, financing commitment or assurance of investment return. All target-rent scenarios, modeled costs, rates, projections and valuations are explicitly hypothetical. This research draft should not be inserted into a member issue without source evidence, final arithmetic verification and author approval.
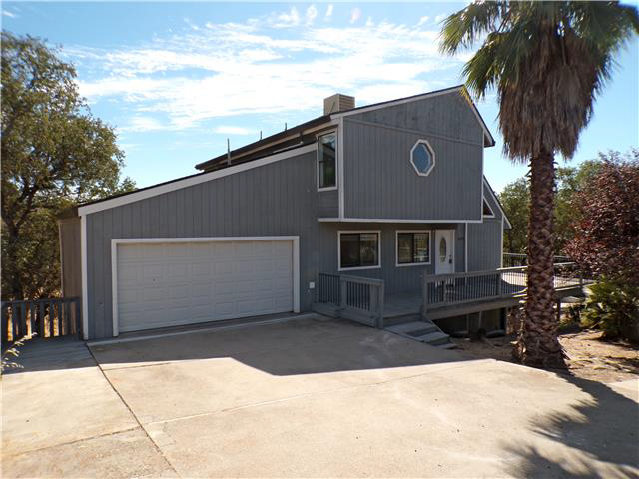
4271 Council Trl
Copperopolis, CA 95228
$320,000 asking
At the asking price
$2,134/mo gross rent for an 8% gross yield
$19,200/yr NOI for a 6% cap rate
$25,600/yr NOI for an 8% cap rate
Illustrative Deal Analyzer · 4271 Council Trl
Educational scenarios, not a rent appraisal, lender quote, repair bid, or offer recommendation. Asking price is from the displayed HUD listing snapshot; every other amount below is a modeling assumption. Confirm listing status and bidding rules with HUD.
Investor scenario · 7% and 8% cap-rate illustrations
Expenses: 1.2% of asking for property tax; 0.5% for insurance; 5% of gross rent for vacancy; 8% maintenance; 8% management; 5% capital reserves; 3% miscellaneous. Cap-rate prices equal modeled NOI divided by 0.07 or 0.08. Financing and acquisition costs are excluded from cap-rate calculations.
Investor financing illustration
Financing assumes purchase at the displayed asking price. Cash flow excludes closing costs, points, taxes on investor income, and property-specific unexpected repairs. Lending terms and qualification differ by borrower.
Owner-occupant purchase and renovation illustration
A possible FHA 203(k) renovation illustration only. Actual eligible acquisition and repair amounts, the financed base, minimum investment, mortgage insurance, escrow, interest rate, closing costs, contractor bids and lender approval must be determined separately. The repair allowance is a placeholder, not an estimate of the property’s condition.
Before deciding: Confirm allowable HUD bidder category and bid deadline; obtain current rent comparables, condition report, insurance and tax quotes, inspection and renovation bids, and written financing terms. Check HUD case 049-211320.
Investment Property Analysis
4271 Council Trl, Copperopolis, California · HUD Case 049-211320
ILLUSTRATIVE INVESTMENT ANALYSISPrepared November 16, 2026 · Eric Lawrence Frazier, MBA · DRE 01143484 · NMLS 461807
01 · Acquisition Summary & Investment Decision
The HUD asking price is $320,000. This report evaluates whether the property could support a 7% or 8% capitalization-rate investment and separately describes an owner-occupant purchase. The available source does not establish obtainable rent, condition-adjusted value, contractor costs, insurability or lender eligibility. Consequently, an investment purchase recommendation is withheld pending diligence, not converted from hypothetical rents into a false offer.
Property facts
Single Family Home; 3 bedrooms, 2 baths, 1630 square feet. HOA: $24 monthly. HUD financing classification: IE.
Investor rental restrictions, HOA disclosures, property damage and occupancy have not been independently reviewed.
Evidence classification
HUD listing data Prior official page check for the values shown; current marketability requires recheck.
Modeled assumptions All rents and expense percentages in this report are sensitivity illustrations, not property-specific comps or bids.
02 · Investor Underwriting Method and Required Rent
These are reverse-underwriting scenarios: they calculate the monthly rent the listing would need to justify the asking price at target capitalization rates. They do not claim those rents can be collected. A local market-rent study, unit condition and rental restrictions must determine the actual rent input.
| Measure | 7% target scenario | 8% target scenario |
|---|---|---|
| Required monthly rent | $3,185 | $3,509 |
| Required annual scheduled rent | $38,220 | $42,108 |
| Annual NOI at that hypothetical rent | $22,405 | $25,609 |
| Target yield | 7.00% | 8.00% |
| Monthly rent as % of listing price | 1.00% | 1.10% |
03 · Operating Statement — Year One
Property-specific accounting: 5% vacancy, management equal to 8% of effective income, annual replacement reserve at 5% of gross rents, 1% of asking price for ordinary maintenance, 1.25% tax, 0.5% insurance, and the indicated HOA fee. These are underwriting inputs only; none substitutes for tax records, insurance quotation or service contracts.
| Income / expense line | 7% reverse scenario | 8% reverse scenario |
|---|---|---|
| Gross scheduled rent · threshold assumption | $38,220 | $42,108 |
| Vacancy/credit loss (5%) | −$1,911 | −$2,105 |
| Effective gross income | $36,309 | $40,003 |
| Management (8% of effective income) | −$2,905 | −$3,200 |
| Replacement reserve (5% gross) | −$1,911 | −$2,105 |
| Maintenance reserve (1% price) | −$3,200 | −$3,200 |
| Illustrative tax (1.25% price) | −$4,000 | −$4,000 |
| Illustrative insurance (0.5% price) | −$1,600 | −$1,600 |
| HOA per listing | −$288 | −$288 |
| Total operating costs and reserves | −$13,904 | −$14,394 |
| MODELED NOI | $22,405 | $25,609 |
| Cap rate at HUD asking price | 7.00% | 8.00% |
NOI includes an analytical replacement reserve for conservative modeling; lenders and appraisers may use different standardized definitions. Costs grow with rent only where explicitly modeled below; taxes and insurance are held at the initial price proxy for this working model.
04 · Financing & Capital Required — Investor
Illustrative financing assumes 25% down, 75% loan-to-value, fixed 8.00% annual interest and 30-year amortization. This is not a current lender quote. Investment property financing eligibility, DSCR loan sizing, property type restrictions, credit underwriting and insurance may invalidate this structure.
| Financing item | Modeled amount |
|---|---|
| Purchase price | $320,000 |
| 25% investor down payment | $80,000 |
| Illustrative first mortgage | $240,000 |
| Estimated closing cost at 3% | $9,600 |
| Total initial cash requirement before repairs/reserves | $89,600 |
| Monthly principal & interest at assumed 8% | $1,761 |
| Annual debt service | $21,132 |
| NOI / debt service (7% reverse scenario) | 1.06× |
| Year-one pre-tax cash flow at reverse rent | $1,273 |
| Year-one cash-on-cash on modeled initial cash | 1.42% |
05 · Owner-Occupant and Rehabilitation Path
If a qualified buyer intends to occupy the property, an FHA 203(k) rehabilitation mortgage may be relevant depending on appraisal, condition, eligibility and lender requirements. The arithmetic below uses a simplified 3.5% minimum-equity illustration on the asking price before a verified rehabilitation budget. Financing of improvements, contingencies, financeable fees, limits and valuation is lender-specific.
| Owner-occupant illustration | Before rehab |
|---|---|
| Acquisition price | $320,000 |
| Illustrative 3.5% down on price | $11,200 |
| Base loan before financed fees or repairs | $308,800 |
| Illustrative P&I at an assumed 7% / 30 years | $2,054/month |
| Mortgage insurance, property tax, HOA, homeowners insurance | Not included |
| Contractor bid, contingency, feasibility review | Required |
| FHA renovation total and actual 3.5% cash | Not established |
HUD classification review: HUD class IE: listing classification is not an FHA commitment; appraisal, property condition, rehabilitation scope and underwriting govern.
For an owner-occupant example with verified repairs B, an initial 3.5% illustration is 0.035 × (HUD purchase price + eligible financed rehabilitation costs B), subject to the maximum-mortgage and 203(k) calculations. This is not a statement that every repair dollar is financeable.
06 · Ten-Year Income, Debt and Equity Model
This sensitivity model begins with the required 7% rent—again, a hypothetical threshold, not observed rent—and assumes 3% annual rent growth. It holds fixed price-linked operating expense proxies constant and applies management/reserves to growing rent. The fixed-rate 8% mortgage amortizes over 30 years. Repairs, special assessments, tax reassessments, depreciation, income taxes, rent-control restrictions and major capital events are excluded. The model is not a forecast.
| Year | Monthly rent | NOI | Debt service | Pre-tax cash flow | Loan balance |
|---|---|---|---|---|---|
| Year 1 | $3,185 | $22,405 | $21,132 | $1,273 | $237,995 |
| Year 2 | $3,281 | $23,350 | $21,132 | $2,218 | $235,824 |
| Year 3 | $3,379 | $24,323 | $21,132 | $3,191 | $233,472 |
| Year 4 | $3,480 | $25,326 | $21,132 | $4,193 | $230,926 |
| Year 5 | $3,585 | $26,358 | $21,132 | $5,226 | $228,168 |
| Year 6 | $3,692 | $27,421 | $21,132 | $6,289 | $225,181 |
| Year 7 | $3,803 | $28,517 | $21,132 | $7,384 | $221,946 |
| Year 8 | $3,917 | $29,645 | $21,132 | $8,512 | $218,442 |
| Year 9 | $4,035 | $30,807 | $21,132 | $9,674 | $214,648 |
| Year 10 | $4,156 | $32,004 | $21,132 | $10,871 | $210,539 |
At year ten, scheduled monthly rent would be $4,156 and NOI $32,004, conditional on uninterrupted growth and the initial unverified rent assumption. Cumulative ten-year pre-tax operating cash flow is $58,831 before exit.
07 · Exit Analysis and Sensitivity
At a hypothetical 7.50% terminal cap rate, the year-ten NOI produces a gross exit valuation of $426,714. After assumed 6% selling expenses and debt payoff, the sale would return approximately $190,572 before tax and any unmodeled capital costs. The ten-year illustrative internal rate of return (IRR) is 11.93%, calculated using modeled initial cash, ten annual cash flows and net year-ten sale proceeds. This value is highly sensitive to achievable rents, terminal cap rates and actual property condition.
Ten-year illustrative IRR: rent-growth / exit-cap sensitivity
| Annual rent growth | 6.50% exit cap | 7.50% exit cap | 8.50% exit cap |
|---|---|---|---|
| 1.00% | 7.95% | 4.51% | 0.90% |
| 3.00% | 14.47% | 11.93% | 9.54% |
| 5.00% | 19.58% | 17.45% | 15.52% |
The table is a genuine 10-year cash-flow IRR calculation on the hypothetical reverse-underwriting starting rent. It is not a market-supported expected return. It excludes tax, material repairs, special assessments, insurance spikes and other due-diligence unknowns.
08 · Market, Condition and Compliance Review
Market rent comparables
Unverified. Obtain at least three currently available or recently leased comparable homes, with addresses, bedroom count, condition, date, source, asking versus achieved rent, and documented adjustments.
Condition and capital work
Unverified. Review the HUD property-condition report, addenda, utilities, pest, roof, HVAC, foundation and occupancy, then obtain scope-specific contractor bids and a contingency allowance.
Property operating data
Unverified. Retrieve county tax record, homeowner/hazard insurance quote, actual HOA dues and rental restrictions, municipal license requirements, utilities and property management proposals.
Regulatory review
Unverified. Confirm county/city rent regulation, AB 1482 applicability and exemptions, short-term rental restrictions, local safety and occupancy rules, and HUD bidding eligibility.
09 · Sources, Limitations and Editorial Decision
HUD Home Store — Case 049-211320 (primary source) · HUD property flyer · Official HUD inventory
HUD properties may be placed under contract or sold between editorial preparation and reader access. Readers must confirm current status, eligibility, bid periods, fees, disclosures and price at the source immediately before action. Your Power Is Now to act—but only on verified information.
This independent educational analysis is not a HUD publication, appraisal, broker price opinion, financing commitment or assurance of investment return. All target-rent scenarios, modeled costs, rates, projections and valuations are explicitly hypothetical. This research draft should not be inserted into a member issue without source evidence, final arithmetic verification and author approval.
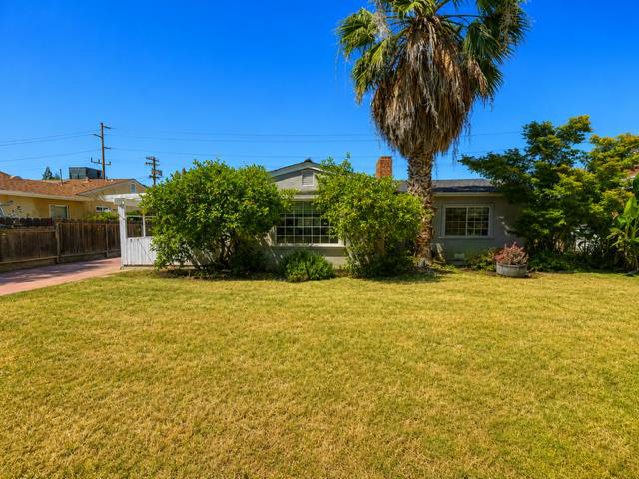
1217 Woodman Way
Modesto, CA 95350
$320,000 asking
At the asking price
$2,134/mo gross rent for an 8% gross yield
$19,200/yr NOI for a 6% cap rate
$25,600/yr NOI for an 8% cap rate
Illustrative Deal Analyzer · 1217 Woodman Way
Educational scenarios, not a rent appraisal, lender quote, repair bid, or offer recommendation. Asking price is from the displayed HUD listing snapshot; every other amount below is a modeling assumption. Confirm listing status and bidding rules with HUD.
Investor scenario · 7% and 8% cap-rate illustrations
Expenses: 1.2% of asking for property tax; 0.5% for insurance; 5% of gross rent for vacancy; 8% maintenance; 8% management; 5% capital reserves; 3% miscellaneous. Cap-rate prices equal modeled NOI divided by 0.07 or 0.08. Financing and acquisition costs are excluded from cap-rate calculations.
Investor financing illustration
Financing assumes purchase at the displayed asking price. Cash flow excludes closing costs, points, taxes on investor income, and property-specific unexpected repairs. Lending terms and qualification differ by borrower.
Owner-occupant purchase and renovation illustration
A possible FHA 203(k) renovation illustration only. Actual eligible acquisition and repair amounts, the financed base, minimum investment, mortgage insurance, escrow, interest rate, closing costs, contractor bids and lender approval must be determined separately. The repair allowance is a placeholder, not an estimate of the property’s condition.
Before deciding: Confirm allowable HUD bidder category and bid deadline; obtain current rent comparables, condition report, insurance and tax quotes, inspection and renovation bids, and written financing terms. Check HUD case 045-633026.
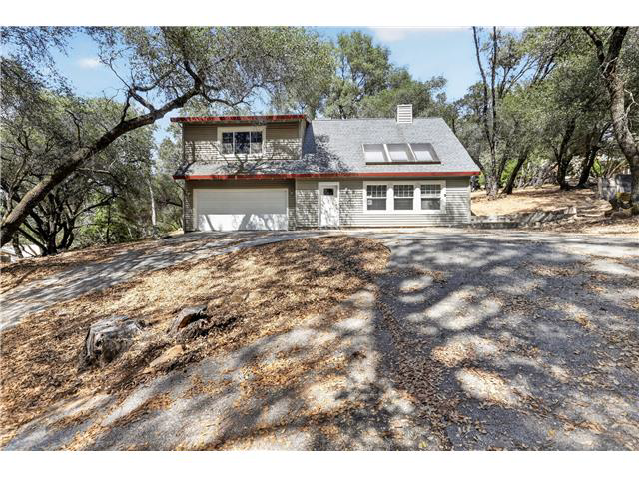
20197 Chaparral Cir
Penn Valley, CA 95946
$297,000 asking
At the asking price
$1,980/mo gross rent for an 8% gross yield
$17,820/yr NOI for a 6% cap rate
$23,760/yr NOI for an 8% cap rate
Illustrative Deal Analyzer · 20197 Chaparral Cir
Educational scenarios, not a rent appraisal, lender quote, repair bid, or offer recommendation. Asking price is from the displayed HUD listing snapshot; every other amount below is a modeling assumption. Confirm listing status and bidding rules with HUD.
Investor scenario · 7% and 8% cap-rate illustrations
Expenses: 1.2% of asking for property tax; 0.5% for insurance; 5% of gross rent for vacancy; 8% maintenance; 8% management; 5% capital reserves; 3% miscellaneous. Cap-rate prices equal modeled NOI divided by 0.07 or 0.08. Financing and acquisition costs are excluded from cap-rate calculations.
Investor financing illustration
Financing assumes purchase at the displayed asking price. Cash flow excludes closing costs, points, taxes on investor income, and property-specific unexpected repairs. Lending terms and qualification differ by borrower.
Owner-occupant purchase and renovation illustration
A possible FHA 203(k) renovation illustration only. Actual eligible acquisition and repair amounts, the financed base, minimum investment, mortgage insurance, escrow, interest rate, closing costs, contractor bids and lender approval must be determined separately. The repair allowance is a placeholder, not an estimate of the property’s condition.
Before deciding: Confirm allowable HUD bidder category and bid deadline; obtain current rent comparables, condition report, insurance and tax quotes, inspection and renovation bids, and written financing terms. Check HUD case 049-178035.
Investment Property Analysis
20197 Chaparral Cir, Penn Valley, California · HUD Case 049-178035
ILLUSTRATIVE INVESTMENT ANALYSISPrepared November 16, 2026 · Eric Lawrence Frazier, MBA · DRE 01143484 · NMLS 461807
01 · Acquisition Summary & Investment Decision
The HUD asking price is $297,000. This report evaluates whether the property could support a 7% or 8% capitalization-rate investment and separately describes an owner-occupant purchase. The available source does not establish obtainable rent, condition-adjusted value, contractor costs, insurability or lender eligibility. Consequently, an investment purchase recommendation is withheld pending diligence, not converted from hypothetical rents into a false offer.
Property facts
Single Family Home; 3 bedrooms, 2.1 baths, 992 square feet. HOA: $292 monthly. HUD financing classification: IN.
Investor rental restrictions, HOA disclosures, property damage and occupancy have not been independently reviewed.
Evidence classification
HUD listing data Prior official page check for the values shown; current marketability requires recheck.
Modeled assumptions All rents and expense percentages in this report are sensitivity illustrations, not property-specific comps or bids.
02 · Investor Underwriting Method and Required Rent
These are reverse-underwriting scenarios: they calculate the monthly rent the listing would need to justify the asking price at target capitalization rates. They do not claim those rents can be collected. A local market-rent study, unit condition and rental restrictions must determine the actual rent input.
| Measure | 7% target scenario | 8% target scenario |
|---|---|---|
| Required monthly rent | $3,284 | $3,584 |
| Required annual scheduled rent | $39,408 | $43,008 |
| Annual NOI at that hypothetical rent | $20,797 | $23,763 |
| Target yield | 7.00% | 8.00% |
| Monthly rent as % of listing price | 1.11% | 1.21% |
03 · Operating Statement — Year One
Property-specific accounting: 5% vacancy, management equal to 8% of effective income, annual replacement reserve at 5% of gross rents, 1% of asking price for ordinary maintenance, 1.25% tax, 0.5% insurance, and the indicated HOA fee. These are underwriting inputs only; none substitutes for tax records, insurance quotation or service contracts.
| Income / expense line | 7% reverse scenario | 8% reverse scenario |
|---|---|---|
| Gross scheduled rent · threshold assumption | $39,408 | $43,008 |
| Vacancy/credit loss (5%) | −$1,970 | −$2,150 |
| Effective gross income | $37,438 | $40,858 |
| Management (8% of effective income) | −$2,995 | −$3,269 |
| Replacement reserve (5% gross) | −$1,970 | −$2,150 |
| Maintenance reserve (1% price) | −$2,970 | −$2,970 |
| Illustrative tax (1.25% price) | −$3,713 | −$3,713 |
| Illustrative insurance (0.5% price) | −$1,485 | −$1,485 |
| HOA per listing | −$3,508 | −$3,508 |
| Total operating costs and reserves | −$16,641 | −$17,094 |
| MODELED NOI | $20,797 | $23,763 |
| Cap rate at HUD asking price | 7.00% | 8.00% |
NOI includes an analytical replacement reserve for conservative modeling; lenders and appraisers may use different standardized definitions. Costs grow with rent only where explicitly modeled below; taxes and insurance are held at the initial price proxy for this working model.
04 · Financing & Capital Required — Investor
Illustrative financing assumes 25% down, 75% loan-to-value, fixed 8.00% annual interest and 30-year amortization. This is not a current lender quote. Investment property financing eligibility, DSCR loan sizing, property type restrictions, credit underwriting and insurance may invalidate this structure.
| Financing item | Modeled amount |
|---|---|
| Purchase price | $297,000 |
| 25% investor down payment | $74,250 |
| Illustrative first mortgage | $222,750 |
| Estimated closing cost at 3% | $8,910 |
| Total initial cash requirement before repairs/reserves | $83,160 |
| Monthly principal & interest at assumed 8% | $1,634 |
| Annual debt service | $19,614 |
| NOI / debt service (7% reverse scenario) | 1.06× |
| Year-one pre-tax cash flow at reverse rent | $1,183 |
| Year-one cash-on-cash on modeled initial cash | 1.42% |
05 · Owner-Occupant and Rehabilitation Path
If a qualified buyer intends to occupy the property, an FHA 203(k) rehabilitation mortgage may be relevant depending on appraisal, condition, eligibility and lender requirements. The arithmetic below uses a simplified 3.5% minimum-equity illustration on the asking price before a verified rehabilitation budget. Financing of improvements, contingencies, financeable fees, limits and valuation is lender-specific.
| Owner-occupant illustration | Before rehab |
|---|---|
| Acquisition price | $297,000 |
| Illustrative 3.5% down on price | $10,395 |
| Base loan before financed fees or repairs | $286,605 |
| Illustrative P&I at an assumed 7% / 30 years | $1,907/month |
| Mortgage insurance, property tax, HOA, homeowners insurance | Not included |
| Contractor bid, contingency, feasibility review | Required |
| FHA renovation total and actual 3.5% cash | Not established |
HUD classification review: HUD class IN: verify the listing-specific repair escrow and loan eligibility before representing it as FHA financeable.
For an owner-occupant example with verified repairs B, an initial 3.5% illustration is 0.035 × (HUD purchase price + eligible financed rehabilitation costs B), subject to the maximum-mortgage and 203(k) calculations. This is not a statement that every repair dollar is financeable.
06 · Ten-Year Income, Debt and Equity Model
This sensitivity model begins with the required 7% rent—again, a hypothetical threshold, not observed rent—and assumes 3% annual rent growth. It holds fixed price-linked operating expense proxies constant and applies management/reserves to growing rent. The fixed-rate 8% mortgage amortizes over 30 years. Repairs, special assessments, tax reassessments, depreciation, income taxes, rent-control restrictions and major capital events are excluded. The model is not a forecast.
| Year | Monthly rent | NOI | Debt service | Pre-tax cash flow | Loan balance |
|---|---|---|---|---|---|
| Year 1 | $3,284 | $20,797 | $19,614 | $1,183 | $220,889 |
| Year 2 | $3,383 | $21,771 | $19,614 | $2,157 | $218,874 |
| Year 3 | $3,484 | $22,774 | $19,614 | $3,161 | $216,692 |
| Year 4 | $3,589 | $23,808 | $19,614 | $4,194 | $214,328 |
| Year 5 | $3,696 | $24,872 | $19,614 | $5,259 | $211,768 |
| Year 6 | $3,807 | $25,969 | $19,614 | $6,355 | $208,996 |
| Year 7 | $3,921 | $27,098 | $19,614 | $7,485 | $205,993 |
| Year 8 | $4,039 | $28,261 | $19,614 | $8,648 | $202,742 |
| Year 9 | $4,160 | $29,459 | $19,614 | $9,846 | $199,220 |
| Year 10 | $4,285 | $30,693 | $19,614 | $11,080 | $195,407 |
At year ten, scheduled monthly rent would be $4,285 and NOI $30,693, conditional on uninterrupted growth and the initial unverified rent assumption. Cumulative ten-year pre-tax operating cash flow is $59,367 before exit.
07 · Exit Analysis and Sensitivity
At a hypothetical 7.50% terminal cap rate, the year-ten NOI produces a gross exit valuation of $409,245. After assumed 6% selling expenses and debt payoff, the sale would return approximately $189,284 before tax and any unmodeled capital costs. The ten-year illustrative internal rate of return (IRR) is 12.84%, calculated using modeled initial cash, ten annual cash flows and net year-ten sale proceeds. This value is highly sensitive to achievable rents, terminal cap rates and actual property condition.
Ten-year illustrative IRR: rent-growth / exit-cap sensitivity
| Annual rent growth | 6.50% exit cap | 7.50% exit cap | 8.50% exit cap |
|---|---|---|---|
| 1.00% | 8.36% | 5.00% | 1.50% |
| 3.00% | 15.30% | 12.84% | 10.54% |
| 5.00% | 20.65% | 18.58% | 16.73% |
The table is a genuine 10-year cash-flow IRR calculation on the hypothetical reverse-underwriting starting rent. It is not a market-supported expected return. It excludes tax, material repairs, special assessments, insurance spikes and other due-diligence unknowns.
08 · Market, Condition and Compliance Review
Market rent comparables
Unverified. Obtain at least three currently available or recently leased comparable homes, with addresses, bedroom count, condition, date, source, asking versus achieved rent, and documented adjustments.
Condition and capital work
Unverified. Review the HUD property-condition report, addenda, utilities, pest, roof, HVAC, foundation and occupancy, then obtain scope-specific contractor bids and a contingency allowance.
Property operating data
Unverified. Retrieve county tax record, homeowner/hazard insurance quote, actual HOA dues and rental restrictions, municipal license requirements, utilities and property management proposals.
Regulatory review
Unverified. Confirm county/city rent regulation, AB 1482 applicability and exemptions, short-term rental restrictions, local safety and occupancy rules, and HUD bidding eligibility.
09 · Sources, Limitations and Editorial Decision
HUD Home Store — Case 049-178035 (primary source) · HUD property flyer · Official HUD inventory
HUD properties may be placed under contract or sold between editorial preparation and reader access. Readers must confirm current status, eligibility, bid periods, fees, disclosures and price at the source immediately before action. Your Power Is Now to act—but only on verified information.
This independent educational analysis is not a HUD publication, appraisal, broker price opinion, financing commitment or assurance of investment return. All target-rent scenarios, modeled costs, rates, projections and valuations are explicitly hypothetical. This research draft should not be inserted into a member issue without source evidence, final arithmetic verification and author approval.
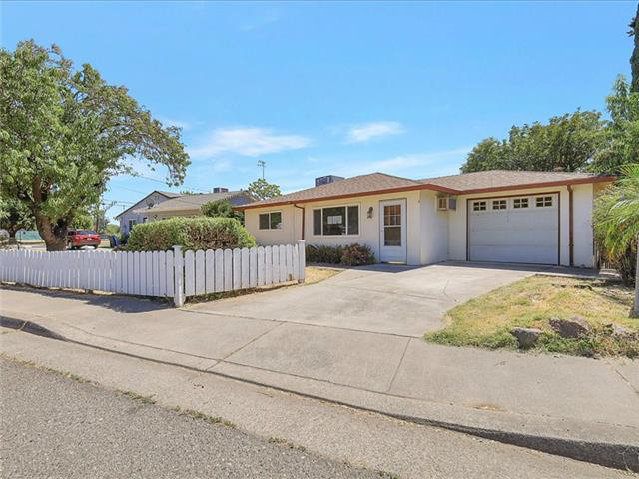
310 Bird St
Yuba City, CA 95991
$290,500 asking
At the asking price
$1,937/mo gross rent for an 8% gross yield
$17,430/yr NOI for a 6% cap rate
$23,240/yr NOI for an 8% cap rate
Illustrative Deal Analyzer · 310 Bird St
Educational scenarios, not a rent appraisal, lender quote, repair bid, or offer recommendation. Asking price is from the displayed HUD listing snapshot; every other amount below is a modeling assumption. Confirm listing status and bidding rules with HUD.
Investor scenario · 7% and 8% cap-rate illustrations
Expenses: 1.2% of asking for property tax; 0.5% for insurance; 5% of gross rent for vacancy; 8% maintenance; 8% management; 5% capital reserves; 3% miscellaneous. Cap-rate prices equal modeled NOI divided by 0.07 or 0.08. Financing and acquisition costs are excluded from cap-rate calculations.
Investor financing illustration
Financing assumes purchase at the displayed asking price. Cash flow excludes closing costs, points, taxes on investor income, and property-specific unexpected repairs. Lending terms and qualification differ by borrower.
Owner-occupant purchase and renovation illustration
A possible FHA 203(k) renovation illustration only. Actual eligible acquisition and repair amounts, the financed base, minimum investment, mortgage insurance, escrow, interest rate, closing costs, contractor bids and lender approval must be determined separately. The repair allowance is a placeholder, not an estimate of the property’s condition.
Before deciding: Confirm allowable HUD bidder category and bid deadline; obtain current rent comparables, condition report, insurance and tax quotes, inspection and renovation bids, and written financing terms. Check HUD case 043-740042.
Investment Property Analysis
310 Bird St, Yuba City, California · HUD Case 043-740042
ILLUSTRATIVE INVESTMENT ANALYSISPrepared November 16, 2026 · Eric Lawrence Frazier, MBA · DRE 01143484 · NMLS 461807
01 · Acquisition Summary & Investment Decision
The HUD asking price is $290,500. This report evaluates whether the property could support a 7% or 8% capitalization-rate investment and separately describes an owner-occupant purchase. The available source does not establish obtainable rent, condition-adjusted value, contractor costs, insurability or lender eligibility. Consequently, an investment purchase recommendation is withheld pending diligence, not converted from hypothetical rents into a false offer.
Property facts
Single Family Home; 2 bedrooms, 1 bath, 1147 square feet. HOA: $0 monthly. HUD financing classification: IN.
Investor rental restrictions, HOA disclosures, property damage and occupancy have not been independently reviewed.
Evidence classification
HUD listing data Prior official page check for the values shown; current marketability requires recheck.
Modeled assumptions All rents and expense percentages in this report are sensitivity illustrations, not property-specific comps or bids.
02 · Investor Underwriting Method and Required Rent
These are reverse-underwriting scenarios: they calculate the monthly rent the listing would need to justify the asking price at target capitalization rates. They do not claim those rents can be collected. A local market-rent study, unit condition and rental restrictions must determine the actual rent input.
| Measure | 7% target scenario | 8% target scenario |
|---|---|---|
| Required monthly rent | $2,865 | $3,159 |
| Required annual scheduled rent | $34,380 | $37,908 |
| Annual NOI at that hypothetical rent | $20,340 | $23,247 |
| Target yield | 7.00% | 8.00% |
| Monthly rent as % of listing price | 0.99% | 1.09% |
03 · Operating Statement — Year One
Property-specific accounting: 5% vacancy, management equal to 8% of effective income, annual replacement reserve at 5% of gross rents, 1% of asking price for ordinary maintenance, 1.25% tax, 0.5% insurance, and the indicated HOA fee. These are underwriting inputs only; none substitutes for tax records, insurance quotation or service contracts.
| Income / expense line | 7% reverse scenario | 8% reverse scenario |
|---|---|---|
| Gross scheduled rent · threshold assumption | $34,380 | $37,908 |
| Vacancy/credit loss (5%) | −$1,719 | −$1,895 |
| Effective gross income | $32,661 | $36,013 |
| Management (8% of effective income) | −$2,613 | −$2,881 |
| Replacement reserve (5% gross) | −$1,719 | −$1,895 |
| Maintenance reserve (1% price) | −$2,905 | −$2,905 |
| Illustrative tax (1.25% price) | −$3,631 | −$3,631 |
| Illustrative insurance (0.5% price) | −$1,453 | −$1,453 |
| HOA per listing | −$0 | −$0 |
| Total operating costs and reserves | −$12,321 | −$12,765 |
| MODELED NOI | $20,340 | $23,247 |
| Cap rate at HUD asking price | 7.00% | 8.00% |
NOI includes an analytical replacement reserve for conservative modeling; lenders and appraisers may use different standardized definitions. Costs grow with rent only where explicitly modeled below; taxes and insurance are held at the initial price proxy for this working model.
04 · Financing & Capital Required — Investor
Illustrative financing assumes 25% down, 75% loan-to-value, fixed 8.00% annual interest and 30-year amortization. This is not a current lender quote. Investment property financing eligibility, DSCR loan sizing, property type restrictions, credit underwriting and insurance may invalidate this structure.
| Financing item | Modeled amount |
|---|---|
| Purchase price | $290,500 |
| 25% investor down payment | $72,625 |
| Illustrative first mortgage | $217,875 |
| Estimated closing cost at 3% | $8,715 |
| Total initial cash requirement before repairs/reserves | $81,340 |
| Monthly principal & interest at assumed 8% | $1,599 |
| Annual debt service | $19,184 |
| NOI / debt service (7% reverse scenario) | 1.06× |
| Year-one pre-tax cash flow at reverse rent | $1,156 |
| Year-one cash-on-cash on modeled initial cash | 1.42% |
05 · Owner-Occupant and Rehabilitation Path
If a qualified buyer intends to occupy the property, an FHA 203(k) rehabilitation mortgage may be relevant depending on appraisal, condition, eligibility and lender requirements. The arithmetic below uses a simplified 3.5% minimum-equity illustration on the asking price before a verified rehabilitation budget. Financing of improvements, contingencies, financeable fees, limits and valuation is lender-specific.
| Owner-occupant illustration | Before rehab |
|---|---|
| Acquisition price | $290,500 |
| Illustrative 3.5% down on price | $10,168 |
| Base loan before financed fees or repairs | $280,333 |
| Illustrative P&I at an assumed 7% / 30 years | $1,865/month |
| Mortgage insurance, property tax, HOA, homeowners insurance | Not included |
| Contractor bid, contingency, feasibility review | Required |
| FHA renovation total and actual 3.5% cash | Not established |
HUD classification review: HUD class IN: verify the listing-specific repair escrow and loan eligibility before representing it as FHA financeable.
For an owner-occupant example with verified repairs B, an initial 3.5% illustration is 0.035 × (HUD purchase price + eligible financed rehabilitation costs B), subject to the maximum-mortgage and 203(k) calculations. This is not a statement that every repair dollar is financeable.
06 · Ten-Year Income, Debt and Equity Model
This sensitivity model begins with the required 7% rent—again, a hypothetical threshold, not observed rent—and assumes 3% annual rent growth. It holds fixed price-linked operating expense proxies constant and applies management/reserves to growing rent. The fixed-rate 8% mortgage amortizes over 30 years. Repairs, special assessments, tax reassessments, depreciation, income taxes, rent-control restrictions and major capital events are excluded. The model is not a forecast.
| Year | Monthly rent | NOI | Debt service | Pre-tax cash flow | Loan balance |
|---|---|---|---|---|---|
| Year 1 | $2,865 | $20,340 | $19,184 | $1,156 | $216,055 |
| Year 2 | $2,951 | $21,190 | $19,184 | $2,006 | $214,084 |
| Year 3 | $3,039 | $22,066 | $19,184 | $2,881 | $211,949 |
| Year 4 | $3,131 | $22,967 | $19,184 | $3,783 | $209,637 |
| Year 5 | $3,225 | $23,896 | $19,184 | $4,712 | $207,133 |
| Year 6 | $3,321 | $24,852 | $19,184 | $5,668 | $204,422 |
| Year 7 | $3,421 | $25,838 | $19,184 | $6,653 | $201,485 |
| Year 8 | $3,524 | $26,852 | $19,184 | $7,668 | $198,305 |
| Year 9 | $3,629 | $27,898 | $19,184 | $8,713 | $194,860 |
| Year 10 | $3,738 | $28,974 | $19,184 | $9,790 | $191,130 |
At year ten, scheduled monthly rent would be $3,738 and NOI $28,974, conditional on uninterrupted growth and the initial unverified rent assumption. Cumulative ten-year pre-tax operating cash flow is $53,031 before exit.
07 · Exit Analysis and Sensitivity
At a hypothetical 7.50% terminal cap rate, the year-ten NOI produces a gross exit valuation of $386,324. After assumed 6% selling expenses and debt payoff, the sale would return approximately $172,015 before tax and any unmodeled capital costs. The ten-year illustrative internal rate of return (IRR) is 11.86%, calculated using modeled initial cash, ten annual cash flows and net year-ten sale proceeds. This value is highly sensitive to achievable rents, terminal cap rates and actual property condition.
Ten-year illustrative IRR: rent-growth / exit-cap sensitivity
| Annual rent growth | 6.50% exit cap | 7.50% exit cap | 8.50% exit cap |
|---|---|---|---|
| 1.00% | 7.92% | 4.48% | 0.86% |
| 3.00% | 14.40% | 11.86% | 9.45% |
| 5.00% | 19.49% | 17.35% | 15.42% |
The table is a genuine 10-year cash-flow IRR calculation on the hypothetical reverse-underwriting starting rent. It is not a market-supported expected return. It excludes tax, material repairs, special assessments, insurance spikes and other due-diligence unknowns.
08 · Market, Condition and Compliance Review
Market rent comparables
Unverified. Obtain at least three currently available or recently leased comparable homes, with addresses, bedroom count, condition, date, source, asking versus achieved rent, and documented adjustments.
Condition and capital work
Unverified. Review the HUD property-condition report, addenda, utilities, pest, roof, HVAC, foundation and occupancy, then obtain scope-specific contractor bids and a contingency allowance.
Property operating data
Unverified. Retrieve county tax record, homeowner/hazard insurance quote, actual HOA dues and rental restrictions, municipal license requirements, utilities and property management proposals.
Regulatory review
Unverified. Confirm county/city rent regulation, AB 1482 applicability and exemptions, short-term rental restrictions, local safety and occupancy rules, and HUD bidding eligibility.
09 · Sources, Limitations and Editorial Decision
HUD Home Store — Case 043-740042 (primary source) · HUD property flyer · Official HUD inventory
HUD properties may be placed under contract or sold between editorial preparation and reader access. Readers must confirm current status, eligibility, bid periods, fees, disclosures and price at the source immediately before action. Your Power Is Now to act—but only on verified information.
This independent educational analysis is not a HUD publication, appraisal, broker price opinion, financing commitment or assurance of investment return. All target-rent scenarios, modeled costs, rates, projections and valuations are explicitly hypothetical. This research draft should not be inserted into a member issue without source evidence, final arithmetic verification and author approval.
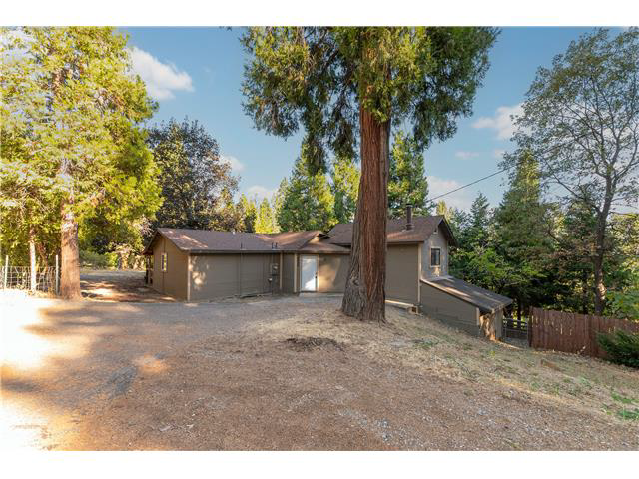
4466 Eight Mile Rd
Camino, CA 95709
$281,000 asking
At the asking price
$1,874/mo gross rent for an 8% gross yield
$16,860/yr NOI for a 6% cap rate
$22,480/yr NOI for an 8% cap rate
Illustrative Deal Analyzer · 4466 Eight Mile Rd
Educational scenarios, not a rent appraisal, lender quote, repair bid, or offer recommendation. Asking price is from the displayed HUD listing snapshot; every other amount below is a modeling assumption. Confirm listing status and bidding rules with HUD.
Investor scenario · 7% and 8% cap-rate illustrations
Expenses: 1.2% of asking for property tax; 0.5% for insurance; 5% of gross rent for vacancy; 8% maintenance; 8% management; 5% capital reserves; 3% miscellaneous. Cap-rate prices equal modeled NOI divided by 0.07 or 0.08. Financing and acquisition costs are excluded from cap-rate calculations.
Investor financing illustration
Financing assumes purchase at the displayed asking price. Cash flow excludes closing costs, points, taxes on investor income, and property-specific unexpected repairs. Lending terms and qualification differ by borrower.
Owner-occupant purchase and renovation illustration
A possible FHA 203(k) renovation illustration only. Actual eligible acquisition and repair amounts, the financed base, minimum investment, mortgage insurance, escrow, interest rate, closing costs, contractor bids and lender approval must be determined separately. The repair allowance is a placeholder, not an estimate of the property’s condition.
Before deciding: Confirm allowable HUD bidder category and bid deadline; obtain current rent comparables, condition report, insurance and tax quotes, inspection and renovation bids, and written financing terms. Check HUD case 049-191712.
Investment Property Analysis
4466 Eight Mile Rd, Camino, California · HUD Case 049-191712
ILLUSTRATIVE INVESTMENT ANALYSISPrepared November 16, 2026 · Eric Lawrence Frazier, MBA · DRE 01143484 · NMLS 461807
01 · Acquisition Summary & Investment Decision
The HUD asking price is $281,000. This report evaluates whether the property could support a 7% or 8% capitalization-rate investment and separately describes an owner-occupant purchase. The available source does not establish obtainable rent, condition-adjusted value, contractor costs, insurability or lender eligibility. Consequently, an investment purchase recommendation is withheld pending diligence, not converted from hypothetical rents into a false offer.
Property facts
Single Family Home; 1 bedroom, 1 bath, 1003 square feet. HOA: $0 monthly. HUD financing classification: IE.
Investor rental restrictions, HOA disclosures, property damage and occupancy have not been independently reviewed.
Evidence classification
HUD listing data Prior official page check for the values shown; current marketability requires recheck.
Modeled assumptions All rents and expense percentages in this report are sensitivity illustrations, not property-specific comps or bids.
02 · Investor Underwriting Method and Required Rent
These are reverse-underwriting scenarios: they calculate the monthly rent the listing would need to justify the asking price at target capitalization rates. They do not claim those rents can be collected. A local market-rent study, unit condition and rental restrictions must determine the actual rent input.
| Measure | 7% target scenario | 8% target scenario |
|---|---|---|
| Required monthly rent | $2,771 | $3,055 |
| Required annual scheduled rent | $33,252 | $36,660 |
| Annual NOI at that hypothetical rent | $19,672 | $22,480 |
| Target yield | 7.00% | 8.00% |
| Monthly rent as % of listing price | 0.99% | 1.09% |
03 · Operating Statement — Year One
Property-specific accounting: 5% vacancy, management equal to 8% of effective income, annual replacement reserve at 5% of gross rents, 1% of asking price for ordinary maintenance, 1.25% tax, 0.5% insurance, and the indicated HOA fee. These are underwriting inputs only; none substitutes for tax records, insurance quotation or service contracts.
| Income / expense line | 7% reverse scenario | 8% reverse scenario |
|---|---|---|
| Gross scheduled rent · threshold assumption | $33,252 | $36,660 |
| Vacancy/credit loss (5%) | −$1,663 | −$1,833 |
| Effective gross income | $31,589 | $34,827 |
| Management (8% of effective income) | −$2,527 | −$2,786 |
| Replacement reserve (5% gross) | −$1,663 | −$1,833 |
| Maintenance reserve (1% price) | −$2,810 | −$2,810 |
| Illustrative tax (1.25% price) | −$3,513 | −$3,513 |
| Illustrative insurance (0.5% price) | −$1,405 | −$1,405 |
| HOA per listing | −$0 | −$0 |
| Total operating costs and reserves | −$11,917 | −$12,347 |
| MODELED NOI | $19,672 | $22,480 |
| Cap rate at HUD asking price | 7.00% | 8.00% |
NOI includes an analytical replacement reserve for conservative modeling; lenders and appraisers may use different standardized definitions. Costs grow with rent only where explicitly modeled below; taxes and insurance are held at the initial price proxy for this working model.
04 · Financing & Capital Required — Investor
Illustrative financing assumes 25% down, 75% loan-to-value, fixed 8.00% annual interest and 30-year amortization. This is not a current lender quote. Investment property financing eligibility, DSCR loan sizing, property type restrictions, credit underwriting and insurance may invalidate this structure.
| Financing item | Modeled amount |
|---|---|
| Purchase price | $281,000 |
| 25% investor down payment | $70,250 |
| Illustrative first mortgage | $210,750 |
| Estimated closing cost at 3% | $8,430 |
| Total initial cash requirement before repairs/reserves | $78,680 |
| Monthly principal & interest at assumed 8% | $1,546 |
| Annual debt service | $18,557 |
| NOI / debt service (7% reverse scenario) | 1.06× |
| Year-one pre-tax cash flow at reverse rent | $1,115 |
| Year-one cash-on-cash on modeled initial cash | 1.42% |
05 · Owner-Occupant and Rehabilitation Path
If a qualified buyer intends to occupy the property, an FHA 203(k) rehabilitation mortgage may be relevant depending on appraisal, condition, eligibility and lender requirements. The arithmetic below uses a simplified 3.5% minimum-equity illustration on the asking price before a verified rehabilitation budget. Financing of improvements, contingencies, financeable fees, limits and valuation is lender-specific.
| Owner-occupant illustration | Before rehab |
|---|---|
| Acquisition price | $281,000 |
| Illustrative 3.5% down on price | $9,835 |
| Base loan before financed fees or repairs | $271,165 |
| Illustrative P&I at an assumed 7% / 30 years | $1,804/month |
| Mortgage insurance, property tax, HOA, homeowners insurance | Not included |
| Contractor bid, contingency, feasibility review | Required |
| FHA renovation total and actual 3.5% cash | Not established |
HUD classification review: HUD class IE: listing classification is not an FHA commitment; appraisal, property condition, rehabilitation scope and underwriting govern.
For an owner-occupant example with verified repairs B, an initial 3.5% illustration is 0.035 × (HUD purchase price + eligible financed rehabilitation costs B), subject to the maximum-mortgage and 203(k) calculations. This is not a statement that every repair dollar is financeable.
06 · Ten-Year Income, Debt and Equity Model
This sensitivity model begins with the required 7% rent—again, a hypothetical threshold, not observed rent—and assumes 3% annual rent growth. It holds fixed price-linked operating expense proxies constant and applies management/reserves to growing rent. The fixed-rate 8% mortgage amortizes over 30 years. Repairs, special assessments, tax reassessments, depreciation, income taxes, rent-control restrictions and major capital events are excluded. The model is not a forecast.
| Year | Monthly rent | NOI | Debt service | Pre-tax cash flow | Loan balance |
|---|---|---|---|---|---|
| Year 1 | $2,771 | $19,672 | $18,557 | $1,115 | $208,989 |
| Year 2 | $2,854 | $20,494 | $18,557 | $1,937 | $207,083 |
| Year 3 | $2,940 | $21,341 | $18,557 | $2,784 | $205,018 |
| Year 4 | $3,028 | $22,213 | $18,557 | $3,656 | $202,782 |
| Year 5 | $3,119 | $23,111 | $18,557 | $4,554 | $200,360 |
| Year 6 | $3,212 | $24,036 | $18,557 | $5,479 | $197,737 |
| Year 7 | $3,309 | $24,989 | $18,557 | $6,432 | $194,896 |
| Year 8 | $3,408 | $25,971 | $18,557 | $7,414 | $191,820 |
| Year 9 | $3,510 | $26,982 | $18,557 | $8,425 | $188,488 |
| Year 10 | $3,616 | $28,023 | $18,557 | $9,466 | $184,880 |
At year ten, scheduled monthly rent would be $3,616 and NOI $28,023, conditional on uninterrupted growth and the initial unverified rent assumption. Cumulative ten-year pre-tax operating cash flow is $51,262 before exit.
07 · Exit Analysis and Sensitivity
At a hypothetical 7.50% terminal cap rate, the year-ten NOI produces a gross exit valuation of $373,638. After assumed 6% selling expenses and debt payoff, the sale would return approximately $166,340 before tax and any unmodeled capital costs. The ten-year illustrative internal rate of return (IRR) is 11.85%, calculated using modeled initial cash, ten annual cash flows and net year-ten sale proceeds. This value is highly sensitive to achievable rents, terminal cap rates and actual property condition.
Ten-year illustrative IRR: rent-growth / exit-cap sensitivity
| Annual rent growth | 6.50% exit cap | 7.50% exit cap | 8.50% exit cap |
|---|---|---|---|
| 1.00% | 7.92% | 4.47% | 0.85% |
| 3.00% | 14.39% | 11.85% | 9.45% |
| 5.00% | 19.49% | 17.35% | 15.41% |
The table is a genuine 10-year cash-flow IRR calculation on the hypothetical reverse-underwriting starting rent. It is not a market-supported expected return. It excludes tax, material repairs, special assessments, insurance spikes and other due-diligence unknowns.
08 · Market, Condition and Compliance Review
Market rent comparables
Unverified. Obtain at least three currently available or recently leased comparable homes, with addresses, bedroom count, condition, date, source, asking versus achieved rent, and documented adjustments.
Condition and capital work
Unverified. Review the HUD property-condition report, addenda, utilities, pest, roof, HVAC, foundation and occupancy, then obtain scope-specific contractor bids and a contingency allowance.
Property operating data
Unverified. Retrieve county tax record, homeowner/hazard insurance quote, actual HOA dues and rental restrictions, municipal license requirements, utilities and property management proposals.
Regulatory review
Unverified. Confirm county/city rent regulation, AB 1482 applicability and exemptions, short-term rental restrictions, local safety and occupancy rules, and HUD bidding eligibility.
09 · Sources, Limitations and Editorial Decision
HUD Home Store — Case 049-191712 (primary source) · HUD property flyer · Official HUD inventory
HUD properties may be placed under contract or sold between editorial preparation and reader access. Readers must confirm current status, eligibility, bid periods, fees, disclosures and price at the source immediately before action. Your Power Is Now to act—but only on verified information.
This independent educational analysis is not a HUD publication, appraisal, broker price opinion, financing commitment or assurance of investment return. All target-rent scenarios, modeled costs, rates, projections and valuations are explicitly hypothetical. This research draft should not be inserted into a member issue without source evidence, final arithmetic verification and author approval.
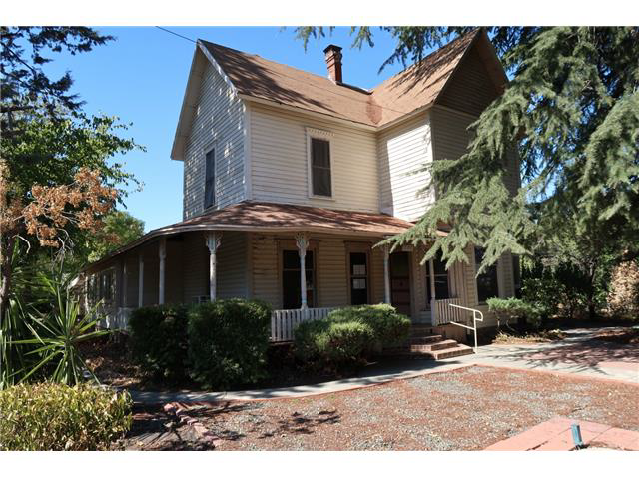
1086 Houghton Ave
Corning, CA 96021
$271,000 asking
At the asking price
$1,807/mo gross rent for an 8% gross yield
$16,260/yr NOI for a 6% cap rate
$21,680/yr NOI for an 8% cap rate
Illustrative Deal Analyzer · 1086 Houghton Ave
Educational scenarios, not a rent appraisal, lender quote, repair bid, or offer recommendation. Asking price is from the displayed HUD listing snapshot; every other amount below is a modeling assumption. Confirm listing status and bidding rules with HUD.
Investor scenario · 7% and 8% cap-rate illustrations
Expenses: 1.2% of asking for property tax; 0.5% for insurance; 5% of gross rent for vacancy; 8% maintenance; 8% management; 5% capital reserves; 3% miscellaneous. Cap-rate prices equal modeled NOI divided by 0.07 or 0.08. Financing and acquisition costs are excluded from cap-rate calculations.
Investor financing illustration
Financing assumes purchase at the displayed asking price. Cash flow excludes closing costs, points, taxes on investor income, and property-specific unexpected repairs. Lending terms and qualification differ by borrower.
Owner-occupant purchase and renovation illustration
A possible FHA 203(k) renovation illustration only. Actual eligible acquisition and repair amounts, the financed base, minimum investment, mortgage insurance, escrow, interest rate, closing costs, contractor bids and lender approval must be determined separately. The repair allowance is a placeholder, not an estimate of the property’s condition.
Before deciding: Confirm allowable HUD bidder category and bid deadline; obtain current rent comparables, condition report, insurance and tax quotes, inspection and renovation bids, and written financing terms. Check HUD case 043-806616.
Investment Property Analysis
1086 Houghton Ave, Corning, California · HUD Case 043-806616
ILLUSTRATIVE INVESTMENT ANALYSISPrepared November 16, 2026 · Eric Lawrence Frazier, MBA · DRE 01143484 · NMLS 461807
01 · Acquisition Summary & Investment Decision
The HUD asking price is $271,000. This report evaluates whether the property could support a 7% or 8% capitalization-rate investment and separately describes an owner-occupant purchase. The available source does not establish obtainable rent, condition-adjusted value, contractor costs, insurability or lender eligibility. Consequently, an investment purchase recommendation is withheld pending diligence, not converted from hypothetical rents into a false offer.
Property facts
Single Family Home; 4 bedrooms, 2 baths, 2328 square feet. HOA: $0 monthly. HUD financing classification: IN.
Investor rental restrictions, HOA disclosures, property damage and occupancy have not been independently reviewed.
Evidence classification
HUD listing data Prior official page check for the values shown; current marketability requires recheck.
Modeled assumptions All rents and expense percentages in this report are sensitivity illustrations, not property-specific comps or bids.
02 · Investor Underwriting Method and Required Rent
These are reverse-underwriting scenarios: they calculate the monthly rent the listing would need to justify the asking price at target capitalization rates. They do not claim those rents can be collected. A local market-rent study, unit condition and rental restrictions must determine the actual rent input.
| Measure | 7% target scenario | 8% target scenario |
|---|---|---|
| Required monthly rent | $2,673 | $2,947 |
| Required annual scheduled rent | $32,076 | $35,364 |
| Annual NOI at that hypothetical rent | $18,978 | $21,687 |
| Target yield | 7.00% | 8.00% |
| Monthly rent as % of listing price | 0.99% | 1.09% |
03 · Operating Statement — Year One
Property-specific accounting: 5% vacancy, management equal to 8% of effective income, annual replacement reserve at 5% of gross rents, 1% of asking price for ordinary maintenance, 1.25% tax, 0.5% insurance, and the indicated HOA fee. These are underwriting inputs only; none substitutes for tax records, insurance quotation or service contracts.
| Income / expense line | 7% reverse scenario | 8% reverse scenario |
|---|---|---|
| Gross scheduled rent · threshold assumption | $32,076 | $35,364 |
| Vacancy/credit loss (5%) | −$1,604 | −$1,768 |
| Effective gross income | $30,472 | $33,596 |
| Management (8% of effective income) | −$2,438 | −$2,688 |
| Replacement reserve (5% gross) | −$1,604 | −$1,768 |
| Maintenance reserve (1% price) | −$2,710 | −$2,710 |
| Illustrative tax (1.25% price) | −$3,388 | −$3,388 |
| Illustrative insurance (0.5% price) | −$1,355 | −$1,355 |
| HOA per listing | −$0 | −$0 |
| Total operating costs and reserves | −$11,494 | −$11,908 |
| MODELED NOI | $18,978 | $21,687 |
| Cap rate at HUD asking price | 7.00% | 8.00% |
NOI includes an analytical replacement reserve for conservative modeling; lenders and appraisers may use different standardized definitions. Costs grow with rent only where explicitly modeled below; taxes and insurance are held at the initial price proxy for this working model.
04 · Financing & Capital Required — Investor
Illustrative financing assumes 25% down, 75% loan-to-value, fixed 8.00% annual interest and 30-year amortization. This is not a current lender quote. Investment property financing eligibility, DSCR loan sizing, property type restrictions, credit underwriting and insurance may invalidate this structure.
| Financing item | Modeled amount |
|---|---|
| Purchase price | $271,000 |
| 25% investor down payment | $67,750 |
| Illustrative first mortgage | $203,250 |
| Estimated closing cost at 3% | $8,130 |
| Total initial cash requirement before repairs/reserves | $75,880 |
| Monthly principal & interest at assumed 8% | $1,491 |
| Annual debt service | $17,897 |
| NOI / debt service (7% reverse scenario) | 1.06× |
| Year-one pre-tax cash flow at reverse rent | $1,082 |
| Year-one cash-on-cash on modeled initial cash | 1.43% |
05 · Owner-Occupant and Rehabilitation Path
If a qualified buyer intends to occupy the property, an FHA 203(k) rehabilitation mortgage may be relevant depending on appraisal, condition, eligibility and lender requirements. The arithmetic below uses a simplified 3.5% minimum-equity illustration on the asking price before a verified rehabilitation budget. Financing of improvements, contingencies, financeable fees, limits and valuation is lender-specific.
| Owner-occupant illustration | Before rehab |
|---|---|
| Acquisition price | $271,000 |
| Illustrative 3.5% down on price | $9,485 |
| Base loan before financed fees or repairs | $261,515 |
| Illustrative P&I at an assumed 7% / 30 years | $1,740/month |
| Mortgage insurance, property tax, HOA, homeowners insurance | Not included |
| Contractor bid, contingency, feasibility review | Required |
| FHA renovation total and actual 3.5% cash | Not established |
HUD classification review: HUD class IN: verify the listing-specific repair escrow and loan eligibility before representing it as FHA financeable.
For an owner-occupant example with verified repairs B, an initial 3.5% illustration is 0.035 × (HUD purchase price + eligible financed rehabilitation costs B), subject to the maximum-mortgage and 203(k) calculations. This is not a statement that every repair dollar is financeable.
06 · Ten-Year Income, Debt and Equity Model
This sensitivity model begins with the required 7% rent—again, a hypothetical threshold, not observed rent—and assumes 3% annual rent growth. It holds fixed price-linked operating expense proxies constant and applies management/reserves to growing rent. The fixed-rate 8% mortgage amortizes over 30 years. Repairs, special assessments, tax reassessments, depreciation, income taxes, rent-control restrictions and major capital events are excluded. The model is not a forecast.
| Year | Monthly rent | NOI | Debt service | Pre-tax cash flow | Loan balance |
|---|---|---|---|---|---|
| Year 1 | $2,673 | $18,978 | $17,897 | $1,082 | $201,552 |
| Year 2 | $2,753 | $19,771 | $17,897 | $1,875 | $199,713 |
| Year 3 | $2,836 | $20,588 | $17,897 | $2,691 | $197,722 |
| Year 4 | $2,921 | $21,429 | $17,897 | $3,532 | $195,565 |
| Year 5 | $3,008 | $22,295 | $17,897 | $4,399 | $193,229 |
| Year 6 | $3,099 | $23,188 | $17,897 | $5,291 | $190,700 |
| Year 7 | $3,192 | $24,107 | $17,897 | $6,211 | $187,960 |
| Year 8 | $3,287 | $25,054 | $17,897 | $7,157 | $184,993 |
| Year 9 | $3,386 | $26,029 | $17,897 | $8,133 | $181,780 |
| Year 10 | $3,488 | $27,033 | $17,897 | $9,137 | $178,300 |
At year ten, scheduled monthly rent would be $3,488 and NOI $27,033, conditional on uninterrupted growth and the initial unverified rent assumption. Cumulative ten-year pre-tax operating cash flow is $49,507 before exit.
07 · Exit Analysis and Sensitivity
At a hypothetical 7.50% terminal cap rate, the year-ten NOI produces a gross exit valuation of $360,446. After assumed 6% selling expenses and debt payoff, the sale would return approximately $160,519 before tax and any unmodeled capital costs. The ten-year illustrative internal rate of return (IRR) is 11.86%, calculated using modeled initial cash, ten annual cash flows and net year-ten sale proceeds. This value is highly sensitive to achievable rents, terminal cap rates and actual property condition.
Ten-year illustrative IRR: rent-growth / exit-cap sensitivity
| Annual rent growth | 6.50% exit cap | 7.50% exit cap | 8.50% exit cap |
|---|---|---|---|
| 1.00% | 7.93% | 4.48% | 0.87% |
| 3.00% | 14.40% | 11.86% | 9.46% |
| 5.00% | 19.50% | 17.36% | 15.42% |
The table is a genuine 10-year cash-flow IRR calculation on the hypothetical reverse-underwriting starting rent. It is not a market-supported expected return. It excludes tax, material repairs, special assessments, insurance spikes and other due-diligence unknowns.
08 · Market, Condition and Compliance Review
Market rent comparables
Unverified. Obtain at least three currently available or recently leased comparable homes, with addresses, bedroom count, condition, date, source, asking versus achieved rent, and documented adjustments.
Condition and capital work
Unverified. Review the HUD property-condition report, addenda, utilities, pest, roof, HVAC, foundation and occupancy, then obtain scope-specific contractor bids and a contingency allowance.
Property operating data
Unverified. Retrieve county tax record, homeowner/hazard insurance quote, actual HOA dues and rental restrictions, municipal license requirements, utilities and property management proposals.
Regulatory review
Unverified. Confirm county/city rent regulation, AB 1482 applicability and exemptions, short-term rental restrictions, local safety and occupancy rules, and HUD bidding eligibility.
09 · Sources, Limitations and Editorial Decision
HUD Home Store — Case 043-806616 (primary source) · HUD property flyer · Official HUD inventory
HUD properties may be placed under contract or sold between editorial preparation and reader access. Readers must confirm current status, eligibility, bid periods, fees, disclosures and price at the source immediately before action. Your Power Is Now to act—but only on verified information.
This independent educational analysis is not a HUD publication, appraisal, broker price opinion, financing commitment or assurance of investment return. All target-rent scenarios, modeled costs, rates, projections and valuations are explicitly hypothetical. This research draft should not be inserted into a member issue without source evidence, final arithmetic verification and author approval.
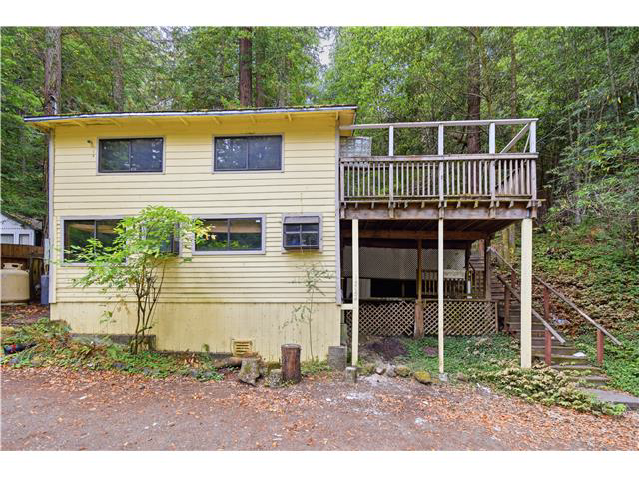
15054 Cherry St
Guerneville, CA 95446
$270,000 asking
At the asking price
$1,800/mo gross rent for an 8% gross yield
$16,200/yr NOI for a 6% cap rate
$21,600/yr NOI for an 8% cap rate
Illustrative Deal Analyzer · 15054 Cherry St
Educational scenarios, not a rent appraisal, lender quote, repair bid, or offer recommendation. Asking price is from the displayed HUD listing snapshot; every other amount below is a modeling assumption. Confirm listing status and bidding rules with HUD.
Investor scenario · 7% and 8% cap-rate illustrations
Expenses: 1.2% of asking for property tax; 0.5% for insurance; 5% of gross rent for vacancy; 8% maintenance; 8% management; 5% capital reserves; 3% miscellaneous. Cap-rate prices equal modeled NOI divided by 0.07 or 0.08. Financing and acquisition costs are excluded from cap-rate calculations.
Investor financing illustration
Financing assumes purchase at the displayed asking price. Cash flow excludes closing costs, points, taxes on investor income, and property-specific unexpected repairs. Lending terms and qualification differ by borrower.
Owner-occupant purchase and renovation illustration
A possible FHA 203(k) renovation illustration only. Actual eligible acquisition and repair amounts, the financed base, minimum investment, mortgage insurance, escrow, interest rate, closing costs, contractor bids and lender approval must be determined separately. The repair allowance is a placeholder, not an estimate of the property’s condition.
Before deciding: Confirm allowable HUD bidder category and bid deadline; obtain current rent comparables, condition report, insurance and tax quotes, inspection and renovation bids, and written financing terms. Check HUD case 198-134840.
Investment Property Analysis
15054 Cherry St, Guerneville, California · HUD Case 198-134840
ILLUSTRATIVE INVESTMENT ANALYSISPrepared November 16, 2026 · Eric Lawrence Frazier, MBA · DRE 01143484 · NMLS 461807
01 · Acquisition Summary & Investment Decision
The HUD asking price is $270,000. This report evaluates whether the property could support a 7% or 8% capitalization-rate investment and separately describes an owner-occupant purchase. The available source does not establish obtainable rent, condition-adjusted value, contractor costs, insurability or lender eligibility. Consequently, an investment purchase recommendation is withheld pending diligence, not converted from hypothetical rents into a false offer.
Property facts
Single Family Home; 2 bedrooms, 2 baths, 1497 square feet. HOA: $0 monthly. HUD financing classification: IE.
Investor rental restrictions, HOA disclosures, property damage and occupancy have not been independently reviewed.
Evidence classification
HUD listing data Prior official page check for the values shown; current marketability requires recheck.
Modeled assumptions All rents and expense percentages in this report are sensitivity illustrations, not property-specific comps or bids.
02 · Investor Underwriting Method and Required Rent
These are reverse-underwriting scenarios: they calculate the monthly rent the listing would need to justify the asking price at target capitalization rates. They do not claim those rents can be collected. A local market-rent study, unit condition and rental restrictions must determine the actual rent input.
| Measure | 7% target scenario | 8% target scenario |
|---|---|---|
| Required monthly rent | $2,663 | $2,936 |
| Required annual scheduled rent | $31,956 | $35,232 |
| Annual NOI at that hypothetical rent | $18,907 | $21,606 |
| Target yield | 7.00% | 8.00% |
| Monthly rent as % of listing price | 0.99% | 1.09% |
03 · Operating Statement — Year One
Property-specific accounting: 5% vacancy, management equal to 8% of effective income, annual replacement reserve at 5% of gross rents, 1% of asking price for ordinary maintenance, 1.25% tax, 0.5% insurance, and the indicated HOA fee. These are underwriting inputs only; none substitutes for tax records, insurance quotation or service contracts.
| Income / expense line | 7% reverse scenario | 8% reverse scenario |
|---|---|---|
| Gross scheduled rent · threshold assumption | $31,956 | $35,232 |
| Vacancy/credit loss (5%) | −$1,598 | −$1,762 |
| Effective gross income | $30,358 | $33,470 |
| Management (8% of effective income) | −$2,429 | −$2,678 |
| Replacement reserve (5% gross) | −$1,598 | −$1,762 |
| Maintenance reserve (1% price) | −$2,700 | −$2,700 |
| Illustrative tax (1.25% price) | −$3,375 | −$3,375 |
| Illustrative insurance (0.5% price) | −$1,350 | −$1,350 |
| HOA per listing | −$0 | −$0 |
| Total operating costs and reserves | −$11,451 | −$11,864 |
| MODELED NOI | $18,907 | $21,606 |
| Cap rate at HUD asking price | 7.00% | 8.00% |
NOI includes an analytical replacement reserve for conservative modeling; lenders and appraisers may use different standardized definitions. Costs grow with rent only where explicitly modeled below; taxes and insurance are held at the initial price proxy for this working model.
04 · Financing & Capital Required — Investor
Illustrative financing assumes 25% down, 75% loan-to-value, fixed 8.00% annual interest and 30-year amortization. This is not a current lender quote. Investment property financing eligibility, DSCR loan sizing, property type restrictions, credit underwriting and insurance may invalidate this structure.
| Financing item | Modeled amount |
|---|---|
| Purchase price | $270,000 |
| 25% investor down payment | $67,500 |
| Illustrative first mortgage | $202,500 |
| Estimated closing cost at 3% | $8,100 |
| Total initial cash requirement before repairs/reserves | $75,600 |
| Monthly principal & interest at assumed 8% | $1,486 |
| Annual debt service | $17,830 |
| NOI / debt service (7% reverse scenario) | 1.06× |
| Year-one pre-tax cash flow at reverse rent | $1,076 |
| Year-one cash-on-cash on modeled initial cash | 1.42% |
05 · Owner-Occupant and Rehabilitation Path
If a qualified buyer intends to occupy the property, an FHA 203(k) rehabilitation mortgage may be relevant depending on appraisal, condition, eligibility and lender requirements. The arithmetic below uses a simplified 3.5% minimum-equity illustration on the asking price before a verified rehabilitation budget. Financing of improvements, contingencies, financeable fees, limits and valuation is lender-specific.
| Owner-occupant illustration | Before rehab |
|---|---|
| Acquisition price | $270,000 |
| Illustrative 3.5% down on price | $9,450 |
| Base loan before financed fees or repairs | $260,550 |
| Illustrative P&I at an assumed 7% / 30 years | $1,733/month |
| Mortgage insurance, property tax, HOA, homeowners insurance | Not included |
| Contractor bid, contingency, feasibility review | Required |
| FHA renovation total and actual 3.5% cash | Not established |
HUD classification review: HUD class IE: listing classification is not an FHA commitment; appraisal, property condition, rehabilitation scope and underwriting govern.
For an owner-occupant example with verified repairs B, an initial 3.5% illustration is 0.035 × (HUD purchase price + eligible financed rehabilitation costs B), subject to the maximum-mortgage and 203(k) calculations. This is not a statement that every repair dollar is financeable.
06 · Ten-Year Income, Debt and Equity Model
This sensitivity model begins with the required 7% rent—again, a hypothetical threshold, not observed rent—and assumes 3% annual rent growth. It holds fixed price-linked operating expense proxies constant and applies management/reserves to growing rent. The fixed-rate 8% mortgage amortizes over 30 years. Repairs, special assessments, tax reassessments, depreciation, income taxes, rent-control restrictions and major capital events are excluded. The model is not a forecast.
| Year | Monthly rent | NOI | Debt service | Pre-tax cash flow | Loan balance |
|---|---|---|---|---|---|
| Year 1 | $2,663 | $18,907 | $17,830 | $1,076 | $200,808 |
| Year 2 | $2,743 | $19,697 | $17,830 | $1,866 | $198,976 |
| Year 3 | $2,825 | $20,510 | $17,830 | $2,680 | $196,992 |
| Year 4 | $2,910 | $21,348 | $17,830 | $3,518 | $194,844 |
| Year 5 | $2,997 | $22,212 | $17,830 | $4,381 | $192,516 |
| Year 6 | $3,087 | $23,101 | $17,830 | $5,270 | $189,996 |
| Year 7 | $3,180 | $24,016 | $17,830 | $6,186 | $187,267 |
| Year 8 | $3,275 | $24,960 | $17,830 | $7,129 | $184,311 |
| Year 9 | $3,373 | $25,931 | $17,830 | $8,101 | $181,110 |
| Year 10 | $3,475 | $26,932 | $17,830 | $9,101 | $177,643 |
At year ten, scheduled monthly rent would be $3,475 and NOI $26,932, conditional on uninterrupted growth and the initial unverified rent assumption. Cumulative ten-year pre-tax operating cash flow is $49,309 before exit.
07 · Exit Analysis and Sensitivity
At a hypothetical 7.50% terminal cap rate, the year-ten NOI produces a gross exit valuation of $359,093. After assumed 6% selling expenses and debt payoff, the sale would return approximately $159,905 before tax and any unmodeled capital costs. The ten-year illustrative internal rate of return (IRR) is 11.86%, calculated using modeled initial cash, ten annual cash flows and net year-ten sale proceeds. This value is highly sensitive to achievable rents, terminal cap rates and actual property condition.
Ten-year illustrative IRR: rent-growth / exit-cap sensitivity
| Annual rent growth | 6.50% exit cap | 7.50% exit cap | 8.50% exit cap |
|---|---|---|---|
| 1.00% | 7.93% | 4.48% | 0.86% |
| 3.00% | 14.40% | 11.86% | 9.46% |
| 5.00% | 19.49% | 17.36% | 15.42% |
The table is a genuine 10-year cash-flow IRR calculation on the hypothetical reverse-underwriting starting rent. It is not a market-supported expected return. It excludes tax, material repairs, special assessments, insurance spikes and other due-diligence unknowns.
08 · Market, Condition and Compliance Review
Market rent comparables
Unverified. Obtain at least three currently available or recently leased comparable homes, with addresses, bedroom count, condition, date, source, asking versus achieved rent, and documented adjustments.
Condition and capital work
Unverified. Review the HUD property-condition report, addenda, utilities, pest, roof, HVAC, foundation and occupancy, then obtain scope-specific contractor bids and a contingency allowance.
Property operating data
Unverified. Retrieve county tax record, homeowner/hazard insurance quote, actual HOA dues and rental restrictions, municipal license requirements, utilities and property management proposals.
Regulatory review
Unverified. Confirm county/city rent regulation, AB 1482 applicability and exemptions, short-term rental restrictions, local safety and occupancy rules, and HUD bidding eligibility.
09 · Sources, Limitations and Editorial Decision
HUD Home Store — Case 198-134840 (primary source) · HUD property flyer · Official HUD inventory
HUD properties may be placed under contract or sold between editorial preparation and reader access. Readers must confirm current status, eligibility, bid periods, fees, disclosures and price at the source immediately before action. Your Power Is Now to act—but only on verified information.
This independent educational analysis is not a HUD publication, appraisal, broker price opinion, financing commitment or assurance of investment return. All target-rent scenarios, modeled costs, rates, projections and valuations are explicitly hypothetical. This research draft should not be inserted into a member issue without source evidence, final arithmetic verification and author approval.
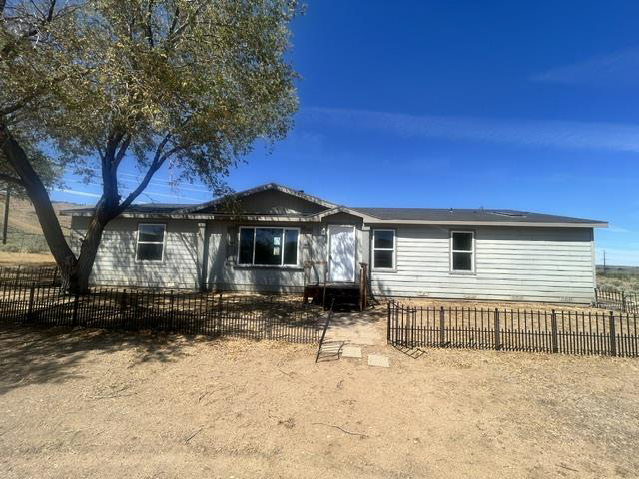
436-850 Old Hwy 395
Doyle, CA 96109
$264,000 asking
At the asking price
$1,760/mo gross rent for an 8% gross yield
$15,840/yr NOI for a 6% cap rate
$21,120/yr NOI for an 8% cap rate
Illustrative Deal Analyzer · 436-850 Old Hwy 395
Educational scenarios, not a rent appraisal, lender quote, repair bid, or offer recommendation. Asking price is from the displayed HUD listing snapshot; every other amount below is a modeling assumption. Confirm listing status and bidding rules with HUD.
Investor scenario · 7% and 8% cap-rate illustrations
Expenses: 1.2% of asking for property tax; 0.5% for insurance; 5% of gross rent for vacancy; 8% maintenance; 8% management; 5% capital reserves; 3% miscellaneous. Cap-rate prices equal modeled NOI divided by 0.07 or 0.08. Financing and acquisition costs are excluded from cap-rate calculations.
Investor financing illustration
Financing assumes purchase at the displayed asking price. Cash flow excludes closing costs, points, taxes on investor income, and property-specific unexpected repairs. Lending terms and qualification differ by borrower.
Owner-occupant purchase and renovation illustration
A possible FHA 203(k) renovation illustration only. Actual eligible acquisition and repair amounts, the financed base, minimum investment, mortgage insurance, escrow, interest rate, closing costs, contractor bids and lender approval must be determined separately. The repair allowance is a placeholder, not an estimate of the property’s condition.
Before deciding: Confirm allowable HUD bidder category and bid deadline; obtain current rent comparables, condition report, insurance and tax quotes, inspection and renovation bids, and written financing terms. Check HUD case 043-973237.
Investment Property Analysis
436-850 Old Hwy 395, Doyle, California · HUD Case 043-973237
ILLUSTRATIVE INVESTMENT ANALYSISPrepared November 16, 2026 · Eric Lawrence Frazier, MBA · DRE 01143484 · NMLS 461807
01 · Acquisition Summary & Investment Decision
The HUD asking price is $264,000. This report evaluates whether the property could support a 7% or 8% capitalization-rate investment and separately describes an owner-occupant purchase. The available source does not establish obtainable rent, condition-adjusted value, contractor costs, insurability or lender eligibility. Consequently, an investment purchase recommendation is withheld pending diligence, not converted from hypothetical rents into a false offer.
Property facts
Manufactured Home; 3 bedrooms, 2 baths, 1920 square feet. HOA: $0 monthly. HUD financing classification: IE.
Investor rental restrictions, HOA disclosures, property damage and occupancy have not been independently reviewed.
Evidence classification
HUD listing data Prior official page check for the values shown; current marketability requires recheck.
Modeled assumptions All rents and expense percentages in this report are sensitivity illustrations, not property-specific comps or bids.
02 · Investor Underwriting Method and Required Rent
These are reverse-underwriting scenarios: they calculate the monthly rent the listing would need to justify the asking price at target capitalization rates. They do not claim those rents can be collected. A local market-rent study, unit condition and rental restrictions must determine the actual rent input.
| Measure | 7% target scenario | 8% target scenario |
|---|---|---|
| Required monthly rent | $2,604 | $2,871 |
| Required annual scheduled rent | $31,248 | $34,452 |
| Annual NOI at that hypothetical rent | $18,488 | $21,128 |
| Target yield | 7.00% | 8.00% |
| Monthly rent as % of listing price | 0.99% | 1.09% |
03 · Operating Statement — Year One
Property-specific accounting: 5% vacancy, management equal to 8% of effective income, annual replacement reserve at 5% of gross rents, 1% of asking price for ordinary maintenance, 1.25% tax, 0.5% insurance, and the indicated HOA fee. These are underwriting inputs only; none substitutes for tax records, insurance quotation or service contracts.
| Income / expense line | 7% reverse scenario | 8% reverse scenario |
|---|---|---|
| Gross scheduled rent · threshold assumption | $31,248 | $34,452 |
| Vacancy/credit loss (5%) | −$1,562 | −$1,723 |
| Effective gross income | $29,686 | $32,729 |
| Management (8% of effective income) | −$2,375 | −$2,618 |
| Replacement reserve (5% gross) | −$1,562 | −$1,723 |
| Maintenance reserve (1% price) | −$2,640 | −$2,640 |
| Illustrative tax (1.25% price) | −$3,300 | −$3,300 |
| Illustrative insurance (0.5% price) | −$1,320 | −$1,320 |
| HOA per listing | −$0 | −$0 |
| Total operating costs and reserves | −$11,197 | −$11,601 |
| MODELED NOI | $18,488 | $21,128 |
| Cap rate at HUD asking price | 7.00% | 8.00% |
NOI includes an analytical replacement reserve for conservative modeling; lenders and appraisers may use different standardized definitions. Costs grow with rent only where explicitly modeled below; taxes and insurance are held at the initial price proxy for this working model.
04 · Financing & Capital Required — Investor
Illustrative financing assumes 25% down, 75% loan-to-value, fixed 8.00% annual interest and 30-year amortization. This is not a current lender quote. Investment property financing eligibility, DSCR loan sizing, property type restrictions, credit underwriting and insurance may invalidate this structure.
| Financing item | Modeled amount |
|---|---|
| Purchase price | $264,000 |
| 25% investor down payment | $66,000 |
| Illustrative first mortgage | $198,000 |
| Estimated closing cost at 3% | $7,920 |
| Total initial cash requirement before repairs/reserves | $73,920 |
| Monthly principal & interest at assumed 8% | $1,453 |
| Annual debt service | $17,434 |
| NOI / debt service (7% reverse scenario) | 1.06× |
| Year-one pre-tax cash flow at reverse rent | $1,054 |
| Year-one cash-on-cash on modeled initial cash | 1.43% |
05 · Owner-Occupant and Rehabilitation Path
If a qualified buyer intends to occupy the property, an FHA 203(k) rehabilitation mortgage may be relevant depending on appraisal, condition, eligibility and lender requirements. The arithmetic below uses a simplified 3.5% minimum-equity illustration on the asking price before a verified rehabilitation budget. Financing of improvements, contingencies, financeable fees, limits and valuation is lender-specific.
| Owner-occupant illustration | Before rehab |
|---|---|
| Acquisition price | $264,000 |
| Illustrative 3.5% down on price | $9,240 |
| Base loan before financed fees or repairs | $254,760 |
| Illustrative P&I at an assumed 7% / 30 years | $1,695/month |
| Mortgage insurance, property tax, HOA, homeowners insurance | Not included |
| Contractor bid, contingency, feasibility review | Required |
| FHA renovation total and actual 3.5% cash | Not established |
HUD classification review: HUD class IE: listing classification is not an FHA commitment; appraisal, property condition, rehabilitation scope and underwriting govern.
For an owner-occupant example with verified repairs B, an initial 3.5% illustration is 0.035 × (HUD purchase price + eligible financed rehabilitation costs B), subject to the maximum-mortgage and 203(k) calculations. This is not a statement that every repair dollar is financeable.
06 · Ten-Year Income, Debt and Equity Model
This sensitivity model begins with the required 7% rent—again, a hypothetical threshold, not observed rent—and assumes 3% annual rent growth. It holds fixed price-linked operating expense proxies constant and applies management/reserves to growing rent. The fixed-rate 8% mortgage amortizes over 30 years. Repairs, special assessments, tax reassessments, depreciation, income taxes, rent-control restrictions and major capital events are excluded. The model is not a forecast.
| Year | Monthly rent | NOI | Debt service | Pre-tax cash flow | Loan balance |
|---|---|---|---|---|---|
| Year 1 | $2,604 | $18,488 | $17,434 | $1,054 | $196,346 |
| Year 2 | $2,682 | $19,261 | $17,434 | $1,827 | $194,555 |
| Year 3 | $2,763 | $20,056 | $17,434 | $2,622 | $192,615 |
| Year 4 | $2,845 | $20,876 | $17,434 | $3,442 | $190,514 |
| Year 5 | $2,931 | $21,720 | $17,434 | $4,286 | $188,238 |
| Year 6 | $3,019 | $22,589 | $17,434 | $5,155 | $185,774 |
| Year 7 | $3,109 | $23,485 | $17,434 | $6,051 | $183,105 |
| Year 8 | $3,203 | $24,407 | $17,434 | $6,973 | $180,215 |
| Year 9 | $3,299 | $25,357 | $17,434 | $7,923 | $177,085 |
| Year 10 | $3,398 | $26,336 | $17,434 | $8,902 | $173,695 |
At year ten, scheduled monthly rent would be $3,398 and NOI $26,336, conditional on uninterrupted growth and the initial unverified rent assumption. Cumulative ten-year pre-tax operating cash flow is $48,234 before exit.
07 · Exit Analysis and Sensitivity
At a hypothetical 7.50% terminal cap rate, the year-ten NOI produces a gross exit valuation of $351,143. After assumed 6% selling expenses and debt payoff, the sale would return approximately $156,380 before tax and any unmodeled capital costs. The ten-year illustrative internal rate of return (IRR) is 11.86%, calculated using modeled initial cash, ten annual cash flows and net year-ten sale proceeds. This value is highly sensitive to achievable rents, terminal cap rates and actual property condition.
Ten-year illustrative IRR: rent-growth / exit-cap sensitivity
| Annual rent growth | 6.50% exit cap | 7.50% exit cap | 8.50% exit cap |
|---|---|---|---|
| 1.00% | 7.93% | 4.49% | 0.87% |
| 3.00% | 14.40% | 11.86% | 9.46% |
| 5.00% | 19.50% | 17.36% | 15.42% |
The table is a genuine 10-year cash-flow IRR calculation on the hypothetical reverse-underwriting starting rent. It is not a market-supported expected return. It excludes tax, material repairs, special assessments, insurance spikes and other due-diligence unknowns.
08 · Market, Condition and Compliance Review
Market rent comparables
Unverified. Obtain at least three currently available or recently leased comparable homes, with addresses, bedroom count, condition, date, source, asking versus achieved rent, and documented adjustments.
Condition and capital work
Unverified. Review the HUD property-condition report, addenda, utilities, pest, roof, HVAC, foundation and occupancy, then obtain scope-specific contractor bids and a contingency allowance.
Property operating data
Unverified. Retrieve county tax record, homeowner/hazard insurance quote, actual HOA dues and rental restrictions, municipal license requirements, utilities and property management proposals.
Regulatory review
Unverified. Confirm county/city rent regulation, AB 1482 applicability and exemptions, short-term rental restrictions, local safety and occupancy rules, and HUD bidding eligibility.
09 · Sources, Limitations and Editorial Decision
HUD Home Store — Case 043-973237 (primary source) · HUD property flyer · Official HUD inventory
HUD properties may be placed under contract or sold between editorial preparation and reader access. Readers must confirm current status, eligibility, bid periods, fees, disclosures and price at the source immediately before action. Your Power Is Now to act—but only on verified information.
This independent educational analysis is not a HUD publication, appraisal, broker price opinion, financing commitment or assurance of investment return. All target-rent scenarios, modeled costs, rates, projections and valuations are explicitly hypothetical. This research draft should not be inserted into a member issue without source evidence, final arithmetic verification and author approval.
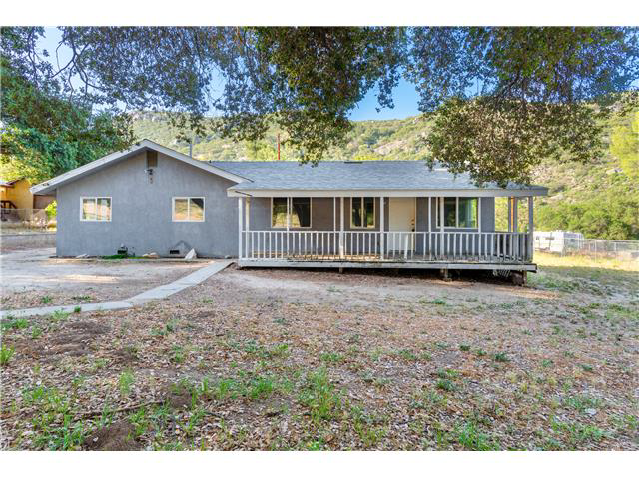
2016 Lake Morena Dr
Campo, CA 91906
$257,300 asking
At the asking price
$1,716/mo gross rent for an 8% gross yield
$15,438/yr NOI for a 6% cap rate
$20,584/yr NOI for an 8% cap rate
Illustrative Deal Analyzer · 2016 Lake Morena Dr
Educational scenarios, not a rent appraisal, lender quote, repair bid, or offer recommendation. Asking price is from the displayed HUD listing snapshot; every other amount below is a modeling assumption. Confirm listing status and bidding rules with HUD.
Investor scenario · 7% and 8% cap-rate illustrations
Expenses: 1.2% of asking for property tax; 0.5% for insurance; 5% of gross rent for vacancy; 8% maintenance; 8% management; 5% capital reserves; 3% miscellaneous. Cap-rate prices equal modeled NOI divided by 0.07 or 0.08. Financing and acquisition costs are excluded from cap-rate calculations.
Investor financing illustration
Financing assumes purchase at the displayed asking price. Cash flow excludes closing costs, points, taxes on investor income, and property-specific unexpected repairs. Lending terms and qualification differ by borrower.
Owner-occupant purchase and renovation illustration
A possible FHA 203(k) renovation illustration only. Actual eligible acquisition and repair amounts, the financed base, minimum investment, mortgage insurance, escrow, interest rate, closing costs, contractor bids and lender approval must be determined separately. The repair allowance is a placeholder, not an estimate of the property’s condition.
Before deciding: Confirm allowable HUD bidder category and bid deadline; obtain current rent comparables, condition report, insurance and tax quotes, inspection and renovation bids, and written financing terms. Check HUD case 044-589335.
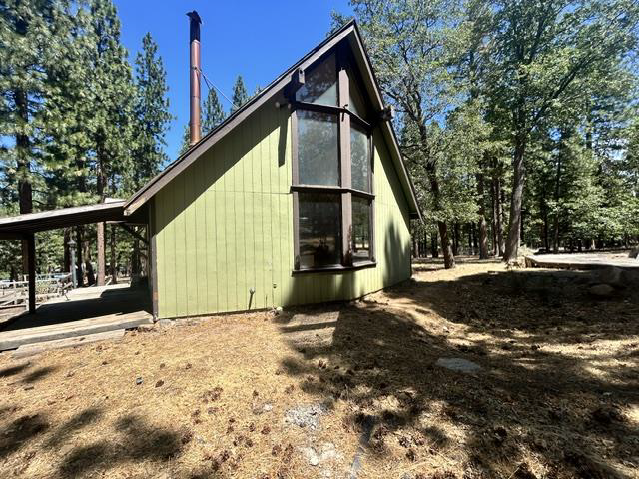
463-505 Raines Rd
Janesville, CA 96114
$241,500 asking
At the asking price
$1,610/mo gross rent for an 8% gross yield
$14,490/yr NOI for a 6% cap rate
$19,320/yr NOI for an 8% cap rate
Illustrative Deal Analyzer · 463-505 Raines Rd
Educational scenarios, not a rent appraisal, lender quote, repair bid, or offer recommendation. Asking price is from the displayed HUD listing snapshot; every other amount below is a modeling assumption. Confirm listing status and bidding rules with HUD.
Investor scenario · 7% and 8% cap-rate illustrations
Expenses: 1.2% of asking for property tax; 0.5% for insurance; 5% of gross rent for vacancy; 8% maintenance; 8% management; 5% capital reserves; 3% miscellaneous. Cap-rate prices equal modeled NOI divided by 0.07 or 0.08. Financing and acquisition costs are excluded from cap-rate calculations.
Investor financing illustration
Financing assumes purchase at the displayed asking price. Cash flow excludes closing costs, points, taxes on investor income, and property-specific unexpected repairs. Lending terms and qualification differ by borrower.
Owner-occupant purchase and renovation illustration
A possible FHA 203(k) renovation illustration only. Actual eligible acquisition and repair amounts, the financed base, minimum investment, mortgage insurance, escrow, interest rate, closing costs, contractor bids and lender approval must be determined separately. The repair allowance is a placeholder, not an estimate of the property’s condition.
Before deciding: Confirm allowable HUD bidder category and bid deadline; obtain current rent comparables, condition report, insurance and tax quotes, inspection and renovation bids, and written financing terms. Check HUD case 049-161674.
Investment Property Analysis
463-505 Raines Rd, Janesville, California · HUD Case 049-161674
ILLUSTRATIVE INVESTMENT ANALYSISPrepared November 16, 2026 · Eric Lawrence Frazier, MBA · DRE 01143484 · NMLS 461807
01 · Acquisition Summary & Investment Decision
The HUD asking price is $241,500. This report evaluates whether the property could support a 7% or 8% capitalization-rate investment and separately describes an owner-occupant purchase. The available source does not establish obtainable rent, condition-adjusted value, contractor costs, insurability or lender eligibility. Consequently, an investment purchase recommendation is withheld pending diligence, not converted from hypothetical rents into a false offer.
Property facts
Single Family Home; 3 bedrooms, 3 baths, 1968 square feet. HOA: $0 monthly. HUD financing classification: IE.
Investor rental restrictions, HOA disclosures, property damage and occupancy have not been independently reviewed.
Evidence classification
HUD listing data Prior official page check for the values shown; current marketability requires recheck.
Modeled assumptions All rents and expense percentages in this report are sensitivity illustrations, not property-specific comps or bids.
02 · Investor Underwriting Method and Required Rent
These are reverse-underwriting scenarios: they calculate the monthly rent the listing would need to justify the asking price at target capitalization rates. They do not claim those rents can be collected. A local market-rent study, unit condition and rental restrictions must determine the actual rent input.
| Measure | 7% target scenario | 8% target scenario |
|---|---|---|
| Required monthly rent | $2,382 | $2,626 |
| Required annual scheduled rent | $28,584 | $31,512 |
| Annual NOI at that hypothetical rent | $16,912 | $19,325 |
| Target yield | 7.00% | 8.00% |
| Monthly rent as % of listing price | 0.99% | 1.09% |
03 · Operating Statement — Year One
Property-specific accounting: 5% vacancy, management equal to 8% of effective income, annual replacement reserve at 5% of gross rents, 1% of asking price for ordinary maintenance, 1.25% tax, 0.5% insurance, and the indicated HOA fee. These are underwriting inputs only; none substitutes for tax records, insurance quotation or service contracts.
| Income / expense line | 7% reverse scenario | 8% reverse scenario |
|---|---|---|
| Gross scheduled rent · threshold assumption | $28,584 | $31,512 |
| Vacancy/credit loss (5%) | −$1,429 | −$1,576 |
| Effective gross income | $27,155 | $29,936 |
| Management (8% of effective income) | −$2,172 | −$2,395 |
| Replacement reserve (5% gross) | −$1,429 | −$1,576 |
| Maintenance reserve (1% price) | −$2,415 | −$2,415 |
| Illustrative tax (1.25% price) | −$3,019 | −$3,019 |
| Illustrative insurance (0.5% price) | −$1,208 | −$1,208 |
| HOA per listing | −$0 | −$0 |
| Total operating costs and reserves | −$10,243 | −$10,612 |
| MODELED NOI | $16,912 | $19,325 |
| Cap rate at HUD asking price | 7.00% | 8.00% |
NOI includes an analytical replacement reserve for conservative modeling; lenders and appraisers may use different standardized definitions. Costs grow with rent only where explicitly modeled below; taxes and insurance are held at the initial price proxy for this working model.
04 · Financing & Capital Required — Investor
Illustrative financing assumes 25% down, 75% loan-to-value, fixed 8.00% annual interest and 30-year amortization. This is not a current lender quote. Investment property financing eligibility, DSCR loan sizing, property type restrictions, credit underwriting and insurance may invalidate this structure.
| Financing item | Modeled amount |
|---|---|
| Purchase price | $241,500 |
| 25% investor down payment | $60,375 |
| Illustrative first mortgage | $181,125 |
| Estimated closing cost at 3% | $7,245 |
| Total initial cash requirement before repairs/reserves | $67,620 |
| Monthly principal & interest at assumed 8% | $1,329 |
| Annual debt service | $15,948 |
| NOI / debt service (7% reverse scenario) | 1.06× |
| Year-one pre-tax cash flow at reverse rent | $964 |
| Year-one cash-on-cash on modeled initial cash | 1.43% |
05 · Owner-Occupant and Rehabilitation Path
If a qualified buyer intends to occupy the property, an FHA 203(k) rehabilitation mortgage may be relevant depending on appraisal, condition, eligibility and lender requirements. The arithmetic below uses a simplified 3.5% minimum-equity illustration on the asking price before a verified rehabilitation budget. Financing of improvements, contingencies, financeable fees, limits and valuation is lender-specific.
| Owner-occupant illustration | Before rehab |
|---|---|
| Acquisition price | $241,500 |
| Illustrative 3.5% down on price | $8,453 |
| Base loan before financed fees or repairs | $233,048 |
| Illustrative P&I at an assumed 7% / 30 years | $1,550/month |
| Mortgage insurance, property tax, HOA, homeowners insurance | Not included |
| Contractor bid, contingency, feasibility review | Required |
| FHA renovation total and actual 3.5% cash | Not established |
HUD classification review: HUD class IE: listing classification is not an FHA commitment; appraisal, property condition, rehabilitation scope and underwriting govern.
For an owner-occupant example with verified repairs B, an initial 3.5% illustration is 0.035 × (HUD purchase price + eligible financed rehabilitation costs B), subject to the maximum-mortgage and 203(k) calculations. This is not a statement that every repair dollar is financeable.
06 · Ten-Year Income, Debt and Equity Model
This sensitivity model begins with the required 7% rent—again, a hypothetical threshold, not observed rent—and assumes 3% annual rent growth. It holds fixed price-linked operating expense proxies constant and applies management/reserves to growing rent. The fixed-rate 8% mortgage amortizes over 30 years. Repairs, special assessments, tax reassessments, depreciation, income taxes, rent-control restrictions and major capital events are excluded. The model is not a forecast.
| Year | Monthly rent | NOI | Debt service | Pre-tax cash flow | Loan balance |
|---|---|---|---|---|---|
| Year 1 | $2,382 | $16,912 | $15,948 | $964 | $179,612 |
| Year 2 | $2,453 | $17,619 | $15,948 | $1,670 | $177,973 |
| Year 3 | $2,527 | $18,346 | $15,948 | $2,398 | $176,199 |
| Year 4 | $2,603 | $19,096 | $15,948 | $3,148 | $174,277 |
| Year 5 | $2,681 | $19,868 | $15,948 | $3,920 | $172,195 |
| Year 6 | $2,761 | $20,663 | $15,948 | $4,715 | $169,941 |
| Year 7 | $2,844 | $21,483 | $15,948 | $5,534 | $167,500 |
| Year 8 | $2,930 | $22,326 | $15,948 | $6,378 | $164,856 |
| Year 9 | $3,017 | $23,195 | $15,948 | $7,247 | $161,992 |
| Year 10 | $3,108 | $24,090 | $15,948 | $8,142 | $158,891 |
At year ten, scheduled monthly rent would be $3,108 and NOI $24,090, conditional on uninterrupted growth and the initial unverified rent assumption. Cumulative ten-year pre-tax operating cash flow is $44,115 before exit.
07 · Exit Analysis and Sensitivity
At a hypothetical 7.50% terminal cap rate, the year-ten NOI produces a gross exit valuation of $321,205. After assumed 6% selling expenses and debt payoff, the sale would return approximately $143,041 before tax and any unmodeled capital costs. The ten-year illustrative internal rate of return (IRR) is 11.86%, calculated using modeled initial cash, ten annual cash flows and net year-ten sale proceeds. This value is highly sensitive to achievable rents, terminal cap rates and actual property condition.
Ten-year illustrative IRR: rent-growth / exit-cap sensitivity
| Annual rent growth | 6.50% exit cap | 7.50% exit cap | 8.50% exit cap |
|---|---|---|---|
| 1.00% | 7.93% | 4.48% | 0.86% |
| 3.00% | 14.40% | 11.86% | 9.46% |
| 5.00% | 19.49% | 17.36% | 15.42% |
The table is a genuine 10-year cash-flow IRR calculation on the hypothetical reverse-underwriting starting rent. It is not a market-supported expected return. It excludes tax, material repairs, special assessments, insurance spikes and other due-diligence unknowns.
08 · Market, Condition and Compliance Review
Market rent comparables
Unverified. Obtain at least three currently available or recently leased comparable homes, with addresses, bedroom count, condition, date, source, asking versus achieved rent, and documented adjustments.
Condition and capital work
Unverified. Review the HUD property-condition report, addenda, utilities, pest, roof, HVAC, foundation and occupancy, then obtain scope-specific contractor bids and a contingency allowance.
Property operating data
Unverified. Retrieve county tax record, homeowner/hazard insurance quote, actual HOA dues and rental restrictions, municipal license requirements, utilities and property management proposals.
Regulatory review
Unverified. Confirm county/city rent regulation, AB 1482 applicability and exemptions, short-term rental restrictions, local safety and occupancy rules, and HUD bidding eligibility.
09 · Sources, Limitations and Editorial Decision
HUD Home Store — Case 049-161674 (primary source) · HUD property flyer · Official HUD inventory
HUD properties may be placed under contract or sold between editorial preparation and reader access. Readers must confirm current status, eligibility, bid periods, fees, disclosures and price at the source immediately before action. Your Power Is Now to act—but only on verified information.
This independent educational analysis is not a HUD publication, appraisal, broker price opinion, financing commitment or assurance of investment return. All target-rent scenarios, modeled costs, rates, projections and valuations are explicitly hypothetical. This research draft should not be inserted into a member issue without source evidence, final arithmetic verification and author approval.
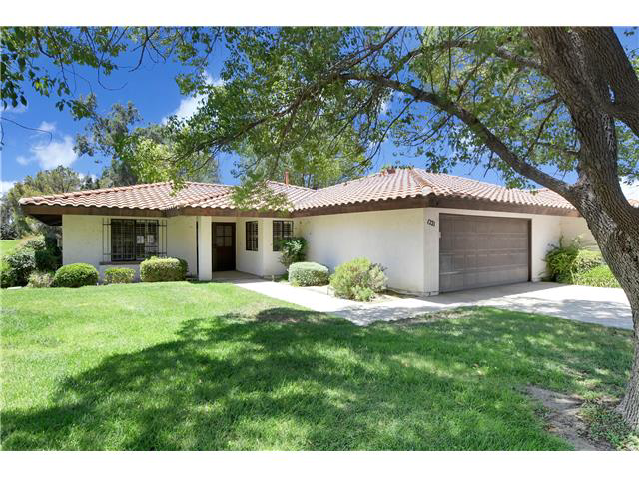
1221 Seven Hills Dr
Hemet, CA 92545
$240,000 asking
At the asking price
$1,600/mo gross rent for an 8% gross yield
$14,400/yr NOI for a 6% cap rate
$19,200/yr NOI for an 8% cap rate
Illustrative Deal Analyzer · 1221 Seven Hills Dr
Educational scenarios, not a rent appraisal, lender quote, repair bid, or offer recommendation. Asking price is from the displayed HUD listing snapshot; every other amount below is a modeling assumption. Confirm listing status and bidding rules with HUD.
Investor scenario · 7% and 8% cap-rate illustrations
Expenses: 1.2% of asking for property tax; 0.5% for insurance; 5% of gross rent for vacancy; 8% maintenance; 8% management; 5% capital reserves; 3% miscellaneous. Cap-rate prices equal modeled NOI divided by 0.07 or 0.08. Financing and acquisition costs are excluded from cap-rate calculations.
Investor financing illustration
Financing assumes purchase at the displayed asking price. Cash flow excludes closing costs, points, taxes on investor income, and property-specific unexpected repairs. Lending terms and qualification differ by borrower.
Owner-occupant purchase and renovation illustration
A possible FHA 203(k) renovation illustration only. Actual eligible acquisition and repair amounts, the financed base, minimum investment, mortgage insurance, escrow, interest rate, closing costs, contractor bids and lender approval must be determined separately. The repair allowance is a placeholder, not an estimate of the property’s condition.
Before deciding: Confirm allowable HUD bidder category and bid deadline; obtain current rent comparables, condition report, insurance and tax quotes, inspection and renovation bids, and written financing terms. Check HUD case 048-447956.
Investment Property Analysis
1221 Seven Hills Dr, Hemet, California · HUD Case 048-447956
ILLUSTRATIVE INVESTMENT ANALYSISPrepared November 16, 2026 · Eric Lawrence Frazier, MBA · DRE 01143484 · NMLS 461807
01 · Acquisition Summary & Investment Decision
The HUD asking price is $240,000. This report evaluates whether the property could support a 7% or 8% capitalization-rate investment and separately describes an owner-occupant purchase. The available source does not establish obtainable rent, condition-adjusted value, contractor costs, insurability or lender eligibility. Consequently, an investment purchase recommendation is withheld pending diligence, not converted from hypothetical rents into a false offer.
Property facts
Condo; 2 bedrooms, 2 baths, 1311 square feet. HOA: $330 monthly. HUD financing classification: IE.
Investor rental restrictions, HOA disclosures, property damage and occupancy have not been independently reviewed.
Evidence classification
HUD listing data Prior official page check for the values shown; current marketability requires recheck.
Modeled assumptions All rents and expense percentages in this report are sensitivity illustrations, not property-specific comps or bids.
02 · Investor Underwriting Method and Required Rent
These are reverse-underwriting scenarios: they calculate the monthly rent the listing would need to justify the asking price at target capitalization rates. They do not claim those rents can be collected. A local market-rent study, unit condition and rental restrictions must determine the actual rent input.
| Measure | 7% target scenario | 8% target scenario |
|---|---|---|
| Required monthly rent | $2,767 | $3,010 |
| Required annual scheduled rent | $33,204 | $36,120 |
| Annual NOI at that hypothetical rent | $16,800 | $19,203 |
| Target yield | 7.00% | 8.00% |
| Monthly rent as % of listing price | 1.15% | 1.25% |
03 · Operating Statement — Year One
Property-specific accounting: 5% vacancy, management equal to 8% of effective income, annual replacement reserve at 5% of gross rents, 1% of asking price for ordinary maintenance, 1.25% tax, 0.5% insurance, and the indicated HOA fee. These are underwriting inputs only; none substitutes for tax records, insurance quotation or service contracts.
| Income / expense line | 7% reverse scenario | 8% reverse scenario |
|---|---|---|
| Gross scheduled rent · threshold assumption | $33,204 | $36,120 |
| Vacancy/credit loss (5%) | −$1,660 | −$1,806 |
| Effective gross income | $31,544 | $34,314 |
| Management (8% of effective income) | −$2,524 | −$2,745 |
| Replacement reserve (5% gross) | −$1,660 | −$1,806 |
| Maintenance reserve (1% price) | −$2,400 | −$2,400 |
| Illustrative tax (1.25% price) | −$3,000 | −$3,000 |
| Illustrative insurance (0.5% price) | −$1,200 | −$1,200 |
| HOA per listing | −$3,960 | −$3,960 |
| Total operating costs and reserves | −$14,744 | −$15,111 |
| MODELED NOI | $16,800 | $19,203 |
| Cap rate at HUD asking price | 7.00% | 8.00% |
NOI includes an analytical replacement reserve for conservative modeling; lenders and appraisers may use different standardized definitions. Costs grow with rent only where explicitly modeled below; taxes and insurance are held at the initial price proxy for this working model.
04 · Financing & Capital Required — Investor
Illustrative financing assumes 25% down, 75% loan-to-value, fixed 8.00% annual interest and 30-year amortization. This is not a current lender quote. Investment property financing eligibility, DSCR loan sizing, property type restrictions, credit underwriting and insurance may invalidate this structure.
| Financing item | Modeled amount |
|---|---|
| Purchase price | $240,000 |
| 25% investor down payment | $60,000 |
| Illustrative first mortgage | $180,000 |
| Estimated closing cost at 3% | $7,200 |
| Total initial cash requirement before repairs/reserves | $67,200 |
| Monthly principal & interest at assumed 8% | $1,321 |
| Annual debt service | $15,849 |
| NOI / debt service (7% reverse scenario) | 1.06× |
| Year-one pre-tax cash flow at reverse rent | $951 |
| Year-one cash-on-cash on modeled initial cash | 1.41% |
05 · Owner-Occupant and Rehabilitation Path
If a qualified buyer intends to occupy the property, an FHA 203(k) rehabilitation mortgage may be relevant depending on appraisal, condition, eligibility and lender requirements. The arithmetic below uses a simplified 3.5% minimum-equity illustration on the asking price before a verified rehabilitation budget. Financing of improvements, contingencies, financeable fees, limits and valuation is lender-specific.
| Owner-occupant illustration | Before rehab |
|---|---|
| Acquisition price | $240,000 |
| Illustrative 3.5% down on price | $8,400 |
| Base loan before financed fees or repairs | $231,600 |
| Illustrative P&I at an assumed 7% / 30 years | $1,541/month |
| Mortgage insurance, property tax, HOA, homeowners insurance | Not included |
| Contractor bid, contingency, feasibility review | Required |
| FHA renovation total and actual 3.5% cash | Not established |
HUD classification review: HUD class IE: listing classification is not an FHA commitment; appraisal, property condition, rehabilitation scope and underwriting govern.
For an owner-occupant example with verified repairs B, an initial 3.5% illustration is 0.035 × (HUD purchase price + eligible financed rehabilitation costs B), subject to the maximum-mortgage and 203(k) calculations. This is not a statement that every repair dollar is financeable.
06 · Ten-Year Income, Debt and Equity Model
This sensitivity model begins with the required 7% rent—again, a hypothetical threshold, not observed rent—and assumes 3% annual rent growth. It holds fixed price-linked operating expense proxies constant and applies management/reserves to growing rent. The fixed-rate 8% mortgage amortizes over 30 years. Repairs, special assessments, tax reassessments, depreciation, income taxes, rent-control restrictions and major capital events are excluded. The model is not a forecast.
| Year | Monthly rent | NOI | Debt service | Pre-tax cash flow | Loan balance |
|---|---|---|---|---|---|
| Year 1 | $2,767 | $16,800 | $15,849 | $951 | $178,496 |
| Year 2 | $2,850 | $17,621 | $15,849 | $1,772 | $176,868 |
| Year 3 | $2,936 | $18,466 | $15,849 | $2,617 | $175,104 |
| Year 4 | $3,024 | $19,337 | $15,849 | $3,488 | $173,194 |
| Year 5 | $3,114 | $20,234 | $15,849 | $4,385 | $171,126 |
| Year 6 | $3,208 | $21,158 | $15,849 | $5,309 | $168,886 |
| Year 7 | $3,304 | $22,109 | $15,849 | $6,260 | $166,459 |
| Year 8 | $3,403 | $23,089 | $15,849 | $7,240 | $163,832 |
| Year 9 | $3,505 | $24,099 | $15,849 | $8,250 | $160,986 |
| Year 10 | $3,610 | $25,139 | $15,849 | $9,289 | $157,904 |
At year ten, scheduled monthly rent would be $3,610 and NOI $25,139, conditional on uninterrupted growth and the initial unverified rent assumption. Cumulative ten-year pre-tax operating cash flow is $49,560 before exit.
07 · Exit Analysis and Sensitivity
At a hypothetical 7.50% terminal cap rate, the year-ten NOI produces a gross exit valuation of $335,183. After assumed 6% selling expenses and debt payoff, the sale would return approximately $157,167 before tax and any unmodeled capital costs. The ten-year illustrative internal rate of return (IRR) is 13.20%, calculated using modeled initial cash, ten annual cash flows and net year-ten sale proceeds. This value is highly sensitive to achievable rents, terminal cap rates and actual property condition.
Ten-year illustrative IRR: rent-growth / exit-cap sensitivity
| Annual rent growth | 6.50% exit cap | 7.50% exit cap | 8.50% exit cap |
|---|---|---|---|
| 1.00% | 8.52% | 5.18% | 1.73% |
| 3.00% | 15.63% | 13.20% | 10.94% |
| 5.00% | 21.08% | 19.04% | 17.21% |
The table is a genuine 10-year cash-flow IRR calculation on the hypothetical reverse-underwriting starting rent. It is not a market-supported expected return. It excludes tax, material repairs, special assessments, insurance spikes and other due-diligence unknowns.
08 · Market, Condition and Compliance Review
Market rent comparables
Unverified. Obtain at least three currently available or recently leased comparable homes, with addresses, bedroom count, condition, date, source, asking versus achieved rent, and documented adjustments.
Condition and capital work
Unverified. Review the HUD property-condition report, addenda, utilities, pest, roof, HVAC, foundation and occupancy, then obtain scope-specific contractor bids and a contingency allowance.
Property operating data
Unverified. Retrieve county tax record, homeowner/hazard insurance quote, actual HOA dues and rental restrictions, municipal license requirements, utilities and property management proposals.
Regulatory review
Unverified. Confirm county/city rent regulation, AB 1482 applicability and exemptions, short-term rental restrictions, local safety and occupancy rules, and HUD bidding eligibility.
09 · Sources, Limitations and Editorial Decision
HUD Home Store — Case 048-447956 (primary source) · HUD property flyer · Official HUD inventory
HUD properties may be placed under contract or sold between editorial preparation and reader access. Readers must confirm current status, eligibility, bid periods, fees, disclosures and price at the source immediately before action. Your Power Is Now to act—but only on verified information.
This independent educational analysis is not a HUD publication, appraisal, broker price opinion, financing commitment or assurance of investment return. All target-rent scenarios, modeled costs, rates, projections and valuations are explicitly hypothetical. This research draft should not be inserted into a member issue without source evidence, final arithmetic verification and author approval.
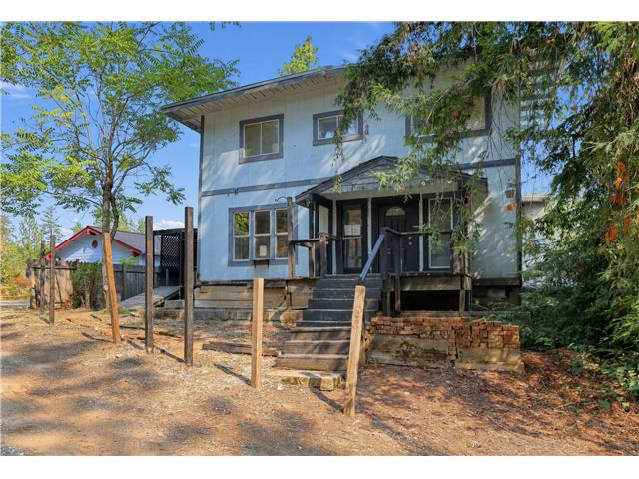
233 W Oak St
Colfax, CA 95713
$220,000 asking
At the asking price
$1,467/mo gross rent for an 8% gross yield
$13,200/yr NOI for a 6% cap rate
$17,600/yr NOI for an 8% cap rate
Illustrative Deal Analyzer · 233 W Oak St
Educational scenarios, not a rent appraisal, lender quote, repair bid, or offer recommendation. Asking price is from the displayed HUD listing snapshot; every other amount below is a modeling assumption. Confirm listing status and bidding rules with HUD.
Investor scenario · 7% and 8% cap-rate illustrations
Expenses: 1.2% of asking for property tax; 0.5% for insurance; 5% of gross rent for vacancy; 8% maintenance; 8% management; 5% capital reserves; 3% miscellaneous. Cap-rate prices equal modeled NOI divided by 0.07 or 0.08. Financing and acquisition costs are excluded from cap-rate calculations.
Investor financing illustration
Financing assumes purchase at the displayed asking price. Cash flow excludes closing costs, points, taxes on investor income, and property-specific unexpected repairs. Lending terms and qualification differ by borrower.
Owner-occupant purchase and renovation illustration
A possible FHA 203(k) renovation illustration only. Actual eligible acquisition and repair amounts, the financed base, minimum investment, mortgage insurance, escrow, interest rate, closing costs, contractor bids and lender approval must be determined separately. The repair allowance is a placeholder, not an estimate of the property’s condition.
Before deciding: Confirm allowable HUD bidder category and bid deadline; obtain current rent comparables, condition report, insurance and tax quotes, inspection and renovation bids, and written financing terms. Check HUD case 043-797519.
Investment Property Analysis
233 W Oak St, Colfax, California · HUD Case 043-797519
ILLUSTRATIVE INVESTMENT ANALYSISPrepared November 16, 2026 · Eric Lawrence Frazier, MBA · DRE 01143484 · NMLS 461807
01 · Acquisition Summary & Investment Decision
The HUD asking price is $220,000. This report evaluates whether the property could support a 7% or 8% capitalization-rate investment and separately describes an owner-occupant purchase. The available source does not establish obtainable rent, condition-adjusted value, contractor costs, insurability or lender eligibility. Consequently, an investment purchase recommendation is withheld pending diligence, not converted from hypothetical rents into a false offer.
Property facts
Single Family Home; 3 bedrooms, 2 baths, 1830 square feet. HOA: $0 monthly. HUD financing classification: UI.
Investor rental restrictions, HOA disclosures, property damage and occupancy have not been independently reviewed.
Evidence classification
HUD listing data Prior official page check for the values shown; current marketability requires recheck.
Modeled assumptions All rents and expense percentages in this report are sensitivity illustrations, not property-specific comps or bids.
02 · Investor Underwriting Method and Required Rent
These are reverse-underwriting scenarios: they calculate the monthly rent the listing would need to justify the asking price at target capitalization rates. They do not claim those rents can be collected. A local market-rent study, unit condition and rental restrictions must determine the actual rent input.
| Measure | 7% target scenario | 8% target scenario |
|---|---|---|
| Required monthly rent | $2,170 | $2,392 |
| Required annual scheduled rent | $26,040 | $28,704 |
| Annual NOI at that hypothetical rent | $15,407 | $17,602 |
| Target yield | 7.00% | 8.00% |
| Monthly rent as % of listing price | 0.99% | 1.09% |
03 · Operating Statement — Year One
Property-specific accounting: 5% vacancy, management equal to 8% of effective income, annual replacement reserve at 5% of gross rents, 1% of asking price for ordinary maintenance, 1.25% tax, 0.5% insurance, and the indicated HOA fee. These are underwriting inputs only; none substitutes for tax records, insurance quotation or service contracts.
| Income / expense line | 7% reverse scenario | 8% reverse scenario |
|---|---|---|
| Gross scheduled rent · threshold assumption | $26,040 | $28,704 |
| Vacancy/credit loss (5%) | −$1,302 | −$1,435 |
| Effective gross income | $24,738 | $27,269 |
| Management (8% of effective income) | −$1,979 | −$2,182 |
| Replacement reserve (5% gross) | −$1,302 | −$1,435 |
| Maintenance reserve (1% price) | −$2,200 | −$2,200 |
| Illustrative tax (1.25% price) | −$2,750 | −$2,750 |
| Illustrative insurance (0.5% price) | −$1,100 | −$1,100 |
| HOA per listing | −$0 | −$0 |
| Total operating costs and reserves | −$9,331 | −$9,667 |
| MODELED NOI | $15,407 | $17,602 |
| Cap rate at HUD asking price | 7.00% | 8.00% |
NOI includes an analytical replacement reserve for conservative modeling; lenders and appraisers may use different standardized definitions. Costs grow with rent only where explicitly modeled below; taxes and insurance are held at the initial price proxy for this working model.
04 · Financing & Capital Required — Investor
Illustrative financing assumes 25% down, 75% loan-to-value, fixed 8.00% annual interest and 30-year amortization. This is not a current lender quote. Investment property financing eligibility, DSCR loan sizing, property type restrictions, credit underwriting and insurance may invalidate this structure.
| Financing item | Modeled amount |
|---|---|
| Purchase price | $220,000 |
| 25% investor down payment | $55,000 |
| Illustrative first mortgage | $165,000 |
| Estimated closing cost at 3% | $6,600 |
| Total initial cash requirement before repairs/reserves | $61,600 |
| Monthly principal & interest at assumed 8% | $1,211 |
| Annual debt service | $14,529 |
| NOI / debt service (7% reverse scenario) | 1.06× |
| Year-one pre-tax cash flow at reverse rent | $878 |
| Year-one cash-on-cash on modeled initial cash | 1.43% |
05 · Owner-Occupant and Rehabilitation Path
If a qualified buyer intends to occupy the property, an FHA 203(k) rehabilitation mortgage may be relevant depending on appraisal, condition, eligibility and lender requirements. The arithmetic below uses a simplified 3.5% minimum-equity illustration on the asking price before a verified rehabilitation budget. Financing of improvements, contingencies, financeable fees, limits and valuation is lender-specific.
| Owner-occupant illustration | Before rehab |
|---|---|
| Acquisition price | $220,000 |
| Illustrative 3.5% down on price | $7,700 |
| Base loan before financed fees or repairs | $212,300 |
| Illustrative P&I at an assumed 7% / 30 years | $1,412/month |
| Mortgage insurance, property tax, HOA, homeowners insurance | Not included |
| Contractor bid, contingency, feasibility review | Required |
| FHA renovation total and actual 3.5% cash | Not established |
HUD classification review: HUD class UI: conventional insured FHA purchase eligibility must not be assumed; investigate rehabilitation financing and lender/insurer restrictions.
For an owner-occupant example with verified repairs B, an initial 3.5% illustration is 0.035 × (HUD purchase price + eligible financed rehabilitation costs B), subject to the maximum-mortgage and 203(k) calculations. This is not a statement that every repair dollar is financeable.
06 · Ten-Year Income, Debt and Equity Model
This sensitivity model begins with the required 7% rent—again, a hypothetical threshold, not observed rent—and assumes 3% annual rent growth. It holds fixed price-linked operating expense proxies constant and applies management/reserves to growing rent. The fixed-rate 8% mortgage amortizes over 30 years. Repairs, special assessments, tax reassessments, depreciation, income taxes, rent-control restrictions and major capital events are excluded. The model is not a forecast.
| Year | Monthly rent | NOI | Debt service | Pre-tax cash flow | Loan balance |
|---|---|---|---|---|---|
| Year 1 | $2,170 | $15,407 | $14,529 | $878 | $163,622 |
| Year 2 | $2,235 | $16,051 | $14,529 | $1,522 | $162,129 |
| Year 3 | $2,302 | $16,714 | $14,529 | $2,185 | $160,512 |
| Year 4 | $2,371 | $17,397 | $14,529 | $2,868 | $158,761 |
| Year 5 | $2,442 | $18,100 | $14,529 | $3,571 | $156,865 |
| Year 6 | $2,516 | $18,824 | $14,529 | $4,296 | $154,812 |
| Year 7 | $2,591 | $19,571 | $14,529 | $5,042 | $152,588 |
| Year 8 | $2,669 | $20,339 | $14,529 | $5,811 | $150,179 |
| Year 9 | $2,749 | $21,131 | $14,529 | $6,602 | $147,571 |
| Year 10 | $2,831 | $21,946 | $14,529 | $7,418 | $144,746 |
At year ten, scheduled monthly rent would be $2,831 and NOI $21,946, conditional on uninterrupted growth and the initial unverified rent assumption. Cumulative ten-year pre-tax operating cash flow is $40,195 before exit.
07 · Exit Analysis and Sensitivity
At a hypothetical 7.50% terminal cap rate, the year-ten NOI produces a gross exit valuation of $292,620. After assumed 6% selling expenses and debt payoff, the sale would return approximately $130,317 before tax and any unmodeled capital costs. The ten-year illustrative internal rate of return (IRR) is 11.86%, calculated using modeled initial cash, ten annual cash flows and net year-ten sale proceeds. This value is highly sensitive to achievable rents, terminal cap rates and actual property condition.
Ten-year illustrative IRR: rent-growth / exit-cap sensitivity
| Annual rent growth | 6.50% exit cap | 7.50% exit cap | 8.50% exit cap |
|---|---|---|---|
| 1.00% | 7.93% | 4.49% | 0.87% |
| 3.00% | 14.40% | 11.86% | 9.46% |
| 5.00% | 19.50% | 17.36% | 15.42% |
The table is a genuine 10-year cash-flow IRR calculation on the hypothetical reverse-underwriting starting rent. It is not a market-supported expected return. It excludes tax, material repairs, special assessments, insurance spikes and other due-diligence unknowns.
08 · Market, Condition and Compliance Review
Market rent comparables
Unverified. Obtain at least three currently available or recently leased comparable homes, with addresses, bedroom count, condition, date, source, asking versus achieved rent, and documented adjustments.
Condition and capital work
Unverified. Review the HUD property-condition report, addenda, utilities, pest, roof, HVAC, foundation and occupancy, then obtain scope-specific contractor bids and a contingency allowance.
Property operating data
Unverified. Retrieve county tax record, homeowner/hazard insurance quote, actual HOA dues and rental restrictions, municipal license requirements, utilities and property management proposals.
Regulatory review
Unverified. Confirm county/city rent regulation, AB 1482 applicability and exemptions, short-term rental restrictions, local safety and occupancy rules, and HUD bidding eligibility.
09 · Sources, Limitations and Editorial Decision
HUD Home Store — Case 043-797519 (primary source) · HUD property flyer · Official HUD inventory
HUD properties may be placed under contract or sold between editorial preparation and reader access. Readers must confirm current status, eligibility, bid periods, fees, disclosures and price at the source immediately before action. Your Power Is Now to act—but only on verified information.
This independent educational analysis is not a HUD publication, appraisal, broker price opinion, financing commitment or assurance of investment return. All target-rent scenarios, modeled costs, rates, projections and valuations are explicitly hypothetical. This research draft should not be inserted into a member issue without source evidence, final arithmetic verification and author approval.
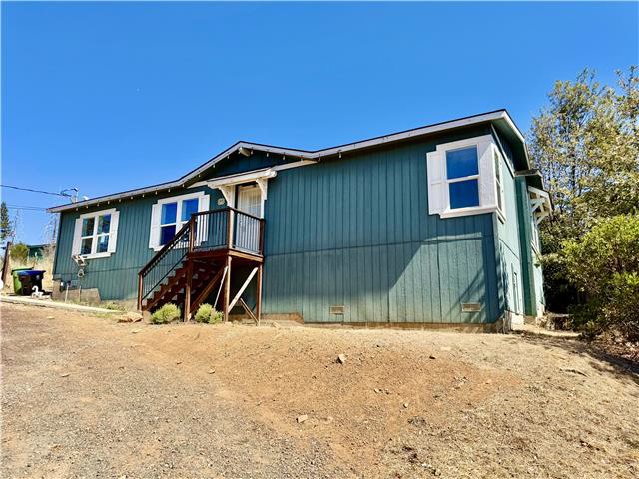
11230 Greenaway Ct
Cobb, CA 95426
$216,000 asking
At the asking price
$1,440/mo gross rent for an 8% gross yield
$12,960/yr NOI for a 6% cap rate
$17,280/yr NOI for an 8% cap rate
Illustrative Deal Analyzer · 11230 Greenaway Ct
Educational scenarios, not a rent appraisal, lender quote, repair bid, or offer recommendation. Asking price is from the displayed HUD listing snapshot; every other amount below is a modeling assumption. Confirm listing status and bidding rules with HUD.
Investor scenario · 7% and 8% cap-rate illustrations
Expenses: 1.2% of asking for property tax; 0.5% for insurance; 5% of gross rent for vacancy; 8% maintenance; 8% management; 5% capital reserves; 3% miscellaneous. Cap-rate prices equal modeled NOI divided by 0.07 or 0.08. Financing and acquisition costs are excluded from cap-rate calculations.
Investor financing illustration
Financing assumes purchase at the displayed asking price. Cash flow excludes closing costs, points, taxes on investor income, and property-specific unexpected repairs. Lending terms and qualification differ by borrower.
Owner-occupant purchase and renovation illustration
A possible FHA 203(k) renovation illustration only. Actual eligible acquisition and repair amounts, the financed base, minimum investment, mortgage insurance, escrow, interest rate, closing costs, contractor bids and lender approval must be determined separately. The repair allowance is a placeholder, not an estimate of the property’s condition.
Before deciding: Confirm allowable HUD bidder category and bid deadline; obtain current rent comparables, condition report, insurance and tax quotes, inspection and renovation bids, and written financing terms. Check HUD case 198-182304.
Investment Property Analysis
11230 Greenaway Ct, Cobb, California · HUD Case 198-182304
ILLUSTRATIVE INVESTMENT ANALYSISPrepared November 16, 2026 · Eric Lawrence Frazier, MBA · DRE 01143484 · NMLS 461807
01 · Acquisition Summary & Investment Decision
The HUD asking price is $216,000. This report evaluates whether the property could support a 7% or 8% capitalization-rate investment and separately describes an owner-occupant purchase. The available source does not establish obtainable rent, condition-adjusted value, contractor costs, insurability or lender eligibility. Consequently, an investment purchase recommendation is withheld pending diligence, not converted from hypothetical rents into a false offer.
Property facts
Manufactured Home; 3 bedrooms, 2 baths, 1467 square feet. HOA: $0 monthly. HUD financing classification: IE.
Investor rental restrictions, HOA disclosures, property damage and occupancy have not been independently reviewed.
Evidence classification
HUD listing data Prior official page check for the values shown; current marketability requires recheck.
Modeled assumptions All rents and expense percentages in this report are sensitivity illustrations, not property-specific comps or bids.
02 · Investor Underwriting Method and Required Rent
These are reverse-underwriting scenarios: they calculate the monthly rent the listing would need to justify the asking price at target capitalization rates. They do not claim those rents can be collected. A local market-rent study, unit condition and rental restrictions must determine the actual rent input.
| Measure | 7% target scenario | 8% target scenario |
|---|---|---|
| Required monthly rent | $2,130 | $2,349 |
| Required annual scheduled rent | $25,560 | $28,188 |
| Annual NOI at that hypothetical rent | $15,121 | $17,287 |
| Target yield | 7.00% | 8.00% |
| Monthly rent as % of listing price | 0.99% | 1.09% |
03 · Operating Statement — Year One
Property-specific accounting: 5% vacancy, management equal to 8% of effective income, annual replacement reserve at 5% of gross rents, 1% of asking price for ordinary maintenance, 1.25% tax, 0.5% insurance, and the indicated HOA fee. These are underwriting inputs only; none substitutes for tax records, insurance quotation or service contracts.
| Income / expense line | 7% reverse scenario | 8% reverse scenario |
|---|---|---|
| Gross scheduled rent · threshold assumption | $25,560 | $28,188 |
| Vacancy/credit loss (5%) | −$1,278 | −$1,409 |
| Effective gross income | $24,282 | $26,779 |
| Management (8% of effective income) | −$1,943 | −$2,142 |
| Replacement reserve (5% gross) | −$1,278 | −$1,409 |
| Maintenance reserve (1% price) | −$2,160 | −$2,160 |
| Illustrative tax (1.25% price) | −$2,700 | −$2,700 |
| Illustrative insurance (0.5% price) | −$1,080 | −$1,080 |
| HOA per listing | −$0 | −$0 |
| Total operating costs and reserves | −$9,161 | −$9,492 |
| MODELED NOI | $15,121 | $17,287 |
| Cap rate at HUD asking price | 7.00% | 8.00% |
NOI includes an analytical replacement reserve for conservative modeling; lenders and appraisers may use different standardized definitions. Costs grow with rent only where explicitly modeled below; taxes and insurance are held at the initial price proxy for this working model.
04 · Financing & Capital Required — Investor
Illustrative financing assumes 25% down, 75% loan-to-value, fixed 8.00% annual interest and 30-year amortization. This is not a current lender quote. Investment property financing eligibility, DSCR loan sizing, property type restrictions, credit underwriting and insurance may invalidate this structure.
| Financing item | Modeled amount |
|---|---|
| Purchase price | $216,000 |
| 25% investor down payment | $54,000 |
| Illustrative first mortgage | $162,000 |
| Estimated closing cost at 3% | $6,480 |
| Total initial cash requirement before repairs/reserves | $60,480 |
| Monthly principal & interest at assumed 8% | $1,189 |
| Annual debt service | $14,264 |
| NOI / debt service (7% reverse scenario) | 1.06× |
| Year-one pre-tax cash flow at reverse rent | $857 |
| Year-one cash-on-cash on modeled initial cash | 1.42% |
05 · Owner-Occupant and Rehabilitation Path
If a qualified buyer intends to occupy the property, an FHA 203(k) rehabilitation mortgage may be relevant depending on appraisal, condition, eligibility and lender requirements. The arithmetic below uses a simplified 3.5% minimum-equity illustration on the asking price before a verified rehabilitation budget. Financing of improvements, contingencies, financeable fees, limits and valuation is lender-specific.
| Owner-occupant illustration | Before rehab |
|---|---|
| Acquisition price | $216,000 |
| Illustrative 3.5% down on price | $7,560 |
| Base loan before financed fees or repairs | $208,440 |
| Illustrative P&I at an assumed 7% / 30 years | $1,387/month |
| Mortgage insurance, property tax, HOA, homeowners insurance | Not included |
| Contractor bid, contingency, feasibility review | Required |
| FHA renovation total and actual 3.5% cash | Not established |
HUD classification review: HUD class IE: listing classification is not an FHA commitment; appraisal, property condition, rehabilitation scope and underwriting govern.
For an owner-occupant example with verified repairs B, an initial 3.5% illustration is 0.035 × (HUD purchase price + eligible financed rehabilitation costs B), subject to the maximum-mortgage and 203(k) calculations. This is not a statement that every repair dollar is financeable.
06 · Ten-Year Income, Debt and Equity Model
This sensitivity model begins with the required 7% rent—again, a hypothetical threshold, not observed rent—and assumes 3% annual rent growth. It holds fixed price-linked operating expense proxies constant and applies management/reserves to growing rent. The fixed-rate 8% mortgage amortizes over 30 years. Repairs, special assessments, tax reassessments, depreciation, income taxes, rent-control restrictions and major capital events are excluded. The model is not a forecast.
| Year | Monthly rent | NOI | Debt service | Pre-tax cash flow | Loan balance |
|---|---|---|---|---|---|
| Year 1 | $2,130 | $15,121 | $14,264 | $857 | $160,647 |
| Year 2 | $2,194 | $15,753 | $14,264 | $1,489 | $159,181 |
| Year 3 | $2,260 | $16,404 | $14,264 | $2,140 | $157,594 |
| Year 4 | $2,328 | $17,074 | $14,264 | $2,810 | $155,875 |
| Year 5 | $2,397 | $17,765 | $14,264 | $3,500 | $154,013 |
| Year 6 | $2,469 | $18,476 | $14,264 | $4,212 | $151,997 |
| Year 7 | $2,543 | $19,208 | $14,264 | $4,944 | $149,813 |
| Year 8 | $2,620 | $19,963 | $14,264 | $5,699 | $147,449 |
| Year 9 | $2,698 | $20,740 | $14,264 | $6,476 | $144,888 |
| Year 10 | $2,779 | $21,540 | $14,264 | $7,276 | $142,114 |
At year ten, scheduled monthly rent would be $2,779 and NOI $21,540, conditional on uninterrupted growth and the initial unverified rent assumption. Cumulative ten-year pre-tax operating cash flow is $39,402 before exit.
07 · Exit Analysis and Sensitivity
At a hypothetical 7.50% terminal cap rate, the year-ten NOI produces a gross exit valuation of $287,205. After assumed 6% selling expenses and debt payoff, the sale would return approximately $127,859 before tax and any unmodeled capital costs. The ten-year illustrative internal rate of return (IRR) is 11.85%, calculated using modeled initial cash, ten annual cash flows and net year-ten sale proceeds. This value is highly sensitive to achievable rents, terminal cap rates and actual property condition.
Ten-year illustrative IRR: rent-growth / exit-cap sensitivity
| Annual rent growth | 6.50% exit cap | 7.50% exit cap | 8.50% exit cap |
|---|---|---|---|
| 1.00% | 7.91% | 4.47% | 0.85% |
| 3.00% | 14.39% | 11.85% | 9.45% |
| 5.00% | 19.49% | 17.35% | 15.41% |
The table is a genuine 10-year cash-flow IRR calculation on the hypothetical reverse-underwriting starting rent. It is not a market-supported expected return. It excludes tax, material repairs, special assessments, insurance spikes and other due-diligence unknowns.
08 · Market, Condition and Compliance Review
Market rent comparables
Unverified. Obtain at least three currently available or recently leased comparable homes, with addresses, bedroom count, condition, date, source, asking versus achieved rent, and documented adjustments.
Condition and capital work
Unverified. Review the HUD property-condition report, addenda, utilities, pest, roof, HVAC, foundation and occupancy, then obtain scope-specific contractor bids and a contingency allowance.
Property operating data
Unverified. Retrieve county tax record, homeowner/hazard insurance quote, actual HOA dues and rental restrictions, municipal license requirements, utilities and property management proposals.
Regulatory review
Unverified. Confirm county/city rent regulation, AB 1482 applicability and exemptions, short-term rental restrictions, local safety and occupancy rules, and HUD bidding eligibility.
09 · Sources, Limitations and Editorial Decision
HUD Home Store — Case 198-182304 (primary source) · HUD property flyer · Official HUD inventory
HUD properties may be placed under contract or sold between editorial preparation and reader access. Readers must confirm current status, eligibility, bid periods, fees, disclosures and price at the source immediately before action. Your Power Is Now to act—but only on verified information.
This independent educational analysis is not a HUD publication, appraisal, broker price opinion, financing commitment or assurance of investment return. All target-rent scenarios, modeled costs, rates, projections and valuations are explicitly hypothetical. This research draft should not be inserted into a member issue without source evidence, final arithmetic verification and author approval.
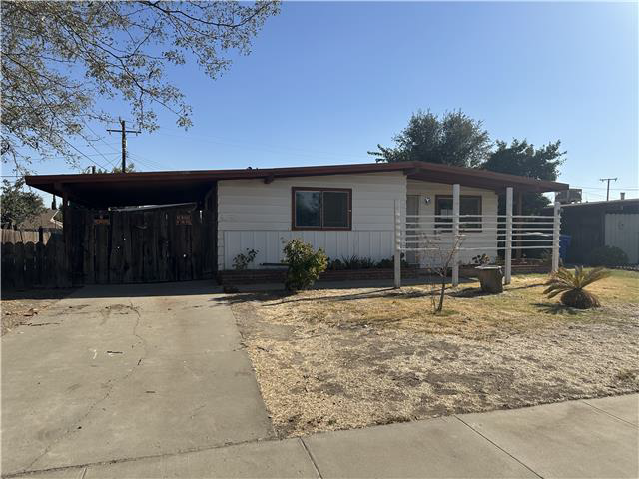
907 Neville St
Hanford, CA 93230
$208,000 asking
At the asking price
$1,387/mo gross rent for an 8% gross yield
$12,480/yr NOI for a 6% cap rate
$16,640/yr NOI for an 8% cap rate
Illustrative Deal Analyzer · 907 Neville St
Educational scenarios, not a rent appraisal, lender quote, repair bid, or offer recommendation. Asking price is from the displayed HUD listing snapshot; every other amount below is a modeling assumption. Confirm listing status and bidding rules with HUD.
Investor scenario · 7% and 8% cap-rate illustrations
Expenses: 1.2% of asking for property tax; 0.5% for insurance; 5% of gross rent for vacancy; 8% maintenance; 8% management; 5% capital reserves; 3% miscellaneous. Cap-rate prices equal modeled NOI divided by 0.07 or 0.08. Financing and acquisition costs are excluded from cap-rate calculations.
Investor financing illustration
Financing assumes purchase at the displayed asking price. Cash flow excludes closing costs, points, taxes on investor income, and property-specific unexpected repairs. Lending terms and qualification differ by borrower.
Owner-occupant purchase and renovation illustration
A possible FHA 203(k) renovation illustration only. Actual eligible acquisition and repair amounts, the financed base, minimum investment, mortgage insurance, escrow, interest rate, closing costs, contractor bids and lender approval must be determined separately. The repair allowance is a placeholder, not an estimate of the property’s condition.
Before deciding: Confirm allowable HUD bidder category and bid deadline; obtain current rent comparables, condition report, insurance and tax quotes, inspection and renovation bids, and written financing terms. Check HUD case 045-682855.
Investment Property Analysis
907 Neville St, Hanford, California · HUD Case 045-682855
ILLUSTRATIVE INVESTMENT ANALYSISPrepared November 16, 2026 · Eric Lawrence Frazier, MBA · DRE 01143484 · NMLS 461807
01 · Acquisition Summary & Investment Decision
The HUD asking price is $208,000. This report evaluates whether the property could support a 7% or 8% capitalization-rate investment and separately describes an owner-occupant purchase. The available source does not establish obtainable rent, condition-adjusted value, contractor costs, insurability or lender eligibility. Consequently, an investment purchase recommendation is withheld pending diligence, not converted from hypothetical rents into a false offer.
Property facts
Single Family Home; 3 bedrooms, 1 bath, 1044 square feet. HOA: $0 monthly. HUD financing classification: IE.
Investor rental restrictions, HOA disclosures, property damage and occupancy have not been independently reviewed.
Evidence classification
HUD listing data Prior official page check for the values shown; current marketability requires recheck.
Modeled assumptions All rents and expense percentages in this report are sensitivity illustrations, not property-specific comps or bids.
02 · Investor Underwriting Method and Required Rent
These are reverse-underwriting scenarios: they calculate the monthly rent the listing would need to justify the asking price at target capitalization rates. They do not claim those rents can be collected. A local market-rent study, unit condition and rental restrictions must determine the actual rent input.
| Measure | 7% target scenario | 8% target scenario |
|---|---|---|
| Required monthly rent | $2,051 | $2,262 |
| Required annual scheduled rent | $24,612 | $27,144 |
| Annual NOI at that hypothetical rent | $14,560 | $16,647 |
| Target yield | 7.00% | 8.00% |
| Monthly rent as % of listing price | 0.99% | 1.09% |
03 · Operating Statement — Year One
Property-specific accounting: 5% vacancy, management equal to 8% of effective income, annual replacement reserve at 5% of gross rents, 1% of asking price for ordinary maintenance, 1.25% tax, 0.5% insurance, and the indicated HOA fee. These are underwriting inputs only; none substitutes for tax records, insurance quotation or service contracts.
| Income / expense line | 7% reverse scenario | 8% reverse scenario |
|---|---|---|
| Gross scheduled rent · threshold assumption | $24,612 | $27,144 |
| Vacancy/credit loss (5%) | −$1,231 | −$1,357 |
| Effective gross income | $23,381 | $25,787 |
| Management (8% of effective income) | −$1,871 | −$2,063 |
| Replacement reserve (5% gross) | −$1,231 | −$1,357 |
| Maintenance reserve (1% price) | −$2,080 | −$2,080 |
| Illustrative tax (1.25% price) | −$2,600 | −$2,600 |
| Illustrative insurance (0.5% price) | −$1,040 | −$1,040 |
| HOA per listing | −$0 | −$0 |
| Total operating costs and reserves | −$8,821 | −$9,140 |
| MODELED NOI | $14,560 | $16,647 |
| Cap rate at HUD asking price | 7.00% | 8.00% |
NOI includes an analytical replacement reserve for conservative modeling; lenders and appraisers may use different standardized definitions. Costs grow with rent only where explicitly modeled below; taxes and insurance are held at the initial price proxy for this working model.
04 · Financing & Capital Required — Investor
Illustrative financing assumes 25% down, 75% loan-to-value, fixed 8.00% annual interest and 30-year amortization. This is not a current lender quote. Investment property financing eligibility, DSCR loan sizing, property type restrictions, credit underwriting and insurance may invalidate this structure.
| Financing item | Modeled amount |
|---|---|
| Purchase price | $208,000 |
| 25% investor down payment | $52,000 |
| Illustrative first mortgage | $156,000 |
| Estimated closing cost at 3% | $6,240 |
| Total initial cash requirement before repairs/reserves | $58,240 |
| Monthly principal & interest at assumed 8% | $1,145 |
| Annual debt service | $13,736 |
| NOI / debt service (7% reverse scenario) | 1.06× |
| Year-one pre-tax cash flow at reverse rent | $824 |
| Year-one cash-on-cash on modeled initial cash | 1.42% |
05 · Owner-Occupant and Rehabilitation Path
If a qualified buyer intends to occupy the property, an FHA 203(k) rehabilitation mortgage may be relevant depending on appraisal, condition, eligibility and lender requirements. The arithmetic below uses a simplified 3.5% minimum-equity illustration on the asking price before a verified rehabilitation budget. Financing of improvements, contingencies, financeable fees, limits and valuation is lender-specific.
| Owner-occupant illustration | Before rehab |
|---|---|
| Acquisition price | $208,000 |
| Illustrative 3.5% down on price | $7,280 |
| Base loan before financed fees or repairs | $200,720 |
| Illustrative P&I at an assumed 7% / 30 years | $1,335/month |
| Mortgage insurance, property tax, HOA, homeowners insurance | Not included |
| Contractor bid, contingency, feasibility review | Required |
| FHA renovation total and actual 3.5% cash | Not established |
HUD classification review: HUD class IE: listing classification is not an FHA commitment; appraisal, property condition, rehabilitation scope and underwriting govern.
For an owner-occupant example with verified repairs B, an initial 3.5% illustration is 0.035 × (HUD purchase price + eligible financed rehabilitation costs B), subject to the maximum-mortgage and 203(k) calculations. This is not a statement that every repair dollar is financeable.
06 · Ten-Year Income, Debt and Equity Model
This sensitivity model begins with the required 7% rent—again, a hypothetical threshold, not observed rent—and assumes 3% annual rent growth. It holds fixed price-linked operating expense proxies constant and applies management/reserves to growing rent. The fixed-rate 8% mortgage amortizes over 30 years. Repairs, special assessments, tax reassessments, depreciation, income taxes, rent-control restrictions and major capital events are excluded. The model is not a forecast.
| Year | Monthly rent | NOI | Debt service | Pre-tax cash flow | Loan balance |
|---|---|---|---|---|---|
| Year 1 | $2,051 | $14,560 | $13,736 | $824 | $154,697 |
| Year 2 | $2,113 | $15,169 | $13,736 | $1,433 | $153,286 |
| Year 3 | $2,176 | $15,795 | $13,736 | $2,059 | $151,757 |
| Year 4 | $2,241 | $16,441 | $13,736 | $2,705 | $150,102 |
| Year 5 | $2,308 | $17,106 | $13,736 | $3,370 | $148,309 |
| Year 6 | $2,378 | $17,790 | $13,736 | $4,054 | $146,367 |
| Year 7 | $2,449 | $18,496 | $13,736 | $4,760 | $144,265 |
| Year 8 | $2,522 | $19,222 | $13,736 | $5,486 | $141,988 |
| Year 9 | $2,598 | $19,970 | $13,736 | $6,234 | $139,521 |
| Year 10 | $2,676 | $20,741 | $13,736 | $7,005 | $136,851 |
At year ten, scheduled monthly rent would be $2,676 and NOI $20,741, conditional on uninterrupted growth and the initial unverified rent assumption. Cumulative ten-year pre-tax operating cash flow is $37,930 before exit.
07 · Exit Analysis and Sensitivity
At a hypothetical 7.50% terminal cap rate, the year-ten NOI produces a gross exit valuation of $276,549. After assumed 6% selling expenses and debt payoff, the sale would return approximately $123,106 before tax and any unmodeled capital costs. The ten-year illustrative internal rate of return (IRR) is 11.85%, calculated using modeled initial cash, ten annual cash flows and net year-ten sale proceeds. This value is highly sensitive to achievable rents, terminal cap rates and actual property condition.
Ten-year illustrative IRR: rent-growth / exit-cap sensitivity
| Annual rent growth | 6.50% exit cap | 7.50% exit cap | 8.50% exit cap |
|---|---|---|---|
| 1.00% | 7.91% | 4.46% | 0.84% |
| 3.00% | 14.39% | 11.85% | 9.44% |
| 5.00% | 19.48% | 17.34% | 15.41% |
The table is a genuine 10-year cash-flow IRR calculation on the hypothetical reverse-underwriting starting rent. It is not a market-supported expected return. It excludes tax, material repairs, special assessments, insurance spikes and other due-diligence unknowns.
08 · Market, Condition and Compliance Review
Market rent comparables
Unverified. Obtain at least three currently available or recently leased comparable homes, with addresses, bedroom count, condition, date, source, asking versus achieved rent, and documented adjustments.
Condition and capital work
Unverified. Review the HUD property-condition report, addenda, utilities, pest, roof, HVAC, foundation and occupancy, then obtain scope-specific contractor bids and a contingency allowance.
Property operating data
Unverified. Retrieve county tax record, homeowner/hazard insurance quote, actual HOA dues and rental restrictions, municipal license requirements, utilities and property management proposals.
Regulatory review
Unverified. Confirm county/city rent regulation, AB 1482 applicability and exemptions, short-term rental restrictions, local safety and occupancy rules, and HUD bidding eligibility.
09 · Sources, Limitations and Editorial Decision
HUD Home Store — Case 045-682855 (primary source) · HUD property flyer · Official HUD inventory
HUD properties may be placed under contract or sold between editorial preparation and reader access. Readers must confirm current status, eligibility, bid periods, fees, disclosures and price at the source immediately before action. Your Power Is Now to act—but only on verified information.
This independent educational analysis is not a HUD publication, appraisal, broker price opinion, financing commitment or assurance of investment return. All target-rent scenarios, modeled costs, rates, projections and valuations are explicitly hypothetical. This research draft should not be inserted into a member issue without source evidence, final arithmetic verification and author approval.
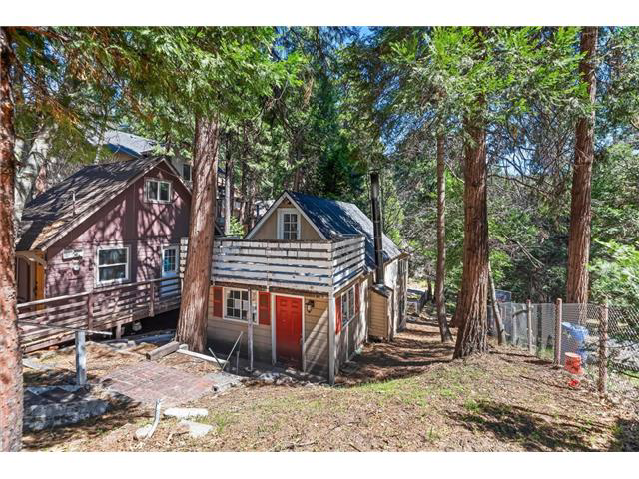
26752 Ca-189
Twin Peaks, CA 92391
$207,000 asking
At the asking price
$1,380/mo gross rent for an 8% gross yield
$12,420/yr NOI for a 6% cap rate
$16,560/yr NOI for an 8% cap rate
Illustrative Deal Analyzer · 26752 Ca-189
Educational scenarios, not a rent appraisal, lender quote, repair bid, or offer recommendation. Asking price is from the displayed HUD listing snapshot; every other amount below is a modeling assumption. Confirm listing status and bidding rules with HUD.
Investor scenario · 7% and 8% cap-rate illustrations
Expenses: 1.2% of asking for property tax; 0.5% for insurance; 5% of gross rent for vacancy; 8% maintenance; 8% management; 5% capital reserves; 3% miscellaneous. Cap-rate prices equal modeled NOI divided by 0.07 or 0.08. Financing and acquisition costs are excluded from cap-rate calculations.
Investor financing illustration
Financing assumes purchase at the displayed asking price. Cash flow excludes closing costs, points, taxes on investor income, and property-specific unexpected repairs. Lending terms and qualification differ by borrower.
Owner-occupant purchase and renovation illustration
A possible FHA 203(k) renovation illustration only. Actual eligible acquisition and repair amounts, the financed base, minimum investment, mortgage insurance, escrow, interest rate, closing costs, contractor bids and lender approval must be determined separately. The repair allowance is a placeholder, not an estimate of the property’s condition.
Before deciding: Confirm allowable HUD bidder category and bid deadline; obtain current rent comparables, condition report, insurance and tax quotes, inspection and renovation bids, and written financing terms. Check HUD case 194-216133.
Investment Property Analysis
26752 CA-189, Twin Peaks, California · HUD Case 194-216133
ILLUSTRATIVE INVESTMENT ANALYSISPrepared November 16, 2026 · Eric Lawrence Frazier, MBA · DRE 01143484 · NMLS 461807
01 · Acquisition Summary & Investment Decision
The HUD asking price is $207,000. This report evaluates whether the property could support a 7% or 8% capitalization-rate investment and separately describes an owner-occupant purchase. The available source does not establish obtainable rent, condition-adjusted value, contractor costs, insurability or lender eligibility. Consequently, an investment purchase recommendation is withheld pending diligence, not converted from hypothetical rents into a false offer.
Property facts
Single Family Home; 1 bedroom, 1 bath, 928 square feet. HOA: $0 monthly. HUD financing classification: IE.
Investor rental restrictions, HOA disclosures, property damage and occupancy have not been independently reviewed.
Evidence classification
HUD listing data Prior official page check for the values shown; current marketability requires recheck.
Modeled assumptions All rents and expense percentages in this report are sensitivity illustrations, not property-specific comps or bids.
02 · Investor Underwriting Method and Required Rent
These are reverse-underwriting scenarios: they calculate the monthly rent the listing would need to justify the asking price at target capitalization rates. They do not claim those rents can be collected. A local market-rent study, unit condition and rental restrictions must determine the actual rent input.
| Measure | 7% target scenario | 8% target scenario |
|---|---|---|
| Required monthly rent | $2,042 | $2,251 |
| Required annual scheduled rent | $24,504 | $27,012 |
| Annual NOI at that hypothetical rent | $14,499 | $16,565 |
| Target yield | 7.00% | 8.00% |
| Monthly rent as % of listing price | 0.99% | 1.09% |
03 · Operating Statement — Year One
Property-specific accounting: 5% vacancy, management equal to 8% of effective income, annual replacement reserve at 5% of gross rents, 1% of asking price for ordinary maintenance, 1.25% tax, 0.5% insurance, and the indicated HOA fee. These are underwriting inputs only; none substitutes for tax records, insurance quotation or service contracts.
| Income / expense line | 7% reverse scenario | 8% reverse scenario |
|---|---|---|
| Gross scheduled rent · threshold assumption | $24,504 | $27,012 |
| Vacancy/credit loss (5%) | −$1,225 | −$1,351 |
| Effective gross income | $23,279 | $25,661 |
| Management (8% of effective income) | −$1,862 | −$2,053 |
| Replacement reserve (5% gross) | −$1,225 | −$1,351 |
| Maintenance reserve (1% price) | −$2,070 | −$2,070 |
| Illustrative tax (1.25% price) | −$2,588 | −$2,588 |
| Illustrative insurance (0.5% price) | −$1,035 | −$1,035 |
| HOA per listing | −$0 | −$0 |
| Total operating costs and reserves | −$8,780 | −$9,096 |
| MODELED NOI | $14,499 | $16,565 |
| Cap rate at HUD asking price | 7.00% | 8.00% |
NOI includes an analytical replacement reserve for conservative modeling; lenders and appraisers may use different standardized definitions. Costs grow with rent only where explicitly modeled below; taxes and insurance are held at the initial price proxy for this working model.
04 · Financing & Capital Required — Investor
Illustrative financing assumes 25% down, 75% loan-to-value, fixed 8.00% annual interest and 30-year amortization. This is not a current lender quote. Investment property financing eligibility, DSCR loan sizing, property type restrictions, credit underwriting and insurance may invalidate this structure.
| Financing item | Modeled amount |
|---|---|
| Purchase price | $207,000 |
| 25% investor down payment | $51,750 |
| Illustrative first mortgage | $155,250 |
| Estimated closing cost at 3% | $6,210 |
| Total initial cash requirement before repairs/reserves | $57,960 |
| Monthly principal & interest at assumed 8% | $1,139 |
| Annual debt service | $13,670 |
| NOI / debt service (7% reverse scenario) | 1.06× |
| Year-one pre-tax cash flow at reverse rent | $829 |
| Year-one cash-on-cash on modeled initial cash | 1.43% |
05 · Owner-Occupant and Rehabilitation Path
If a qualified buyer intends to occupy the property, an FHA 203(k) rehabilitation mortgage may be relevant depending on appraisal, condition, eligibility and lender requirements. The arithmetic below uses a simplified 3.5% minimum-equity illustration on the asking price before a verified rehabilitation budget. Financing of improvements, contingencies, financeable fees, limits and valuation is lender-specific.
| Owner-occupant illustration | Before rehab |
|---|---|
| Acquisition price | $207,000 |
| Illustrative 3.5% down on price | $7,245 |
| Base loan before financed fees or repairs | $199,755 |
| Illustrative P&I at an assumed 7% / 30 years | $1,329/month |
| Mortgage insurance, property tax, HOA, homeowners insurance | Not included |
| Contractor bid, contingency, feasibility review | Required |
| FHA renovation total and actual 3.5% cash | Not established |
HUD classification review: HUD class IE: listing classification is not an FHA commitment; appraisal, property condition, rehabilitation scope and underwriting govern.
For an owner-occupant example with verified repairs B, an initial 3.5% illustration is 0.035 × (HUD purchase price + eligible financed rehabilitation costs B), subject to the maximum-mortgage and 203(k) calculations. This is not a statement that every repair dollar is financeable.
06 · Ten-Year Income, Debt and Equity Model
This sensitivity model begins with the required 7% rent—again, a hypothetical threshold, not observed rent—and assumes 3% annual rent growth. It holds fixed price-linked operating expense proxies constant and applies management/reserves to growing rent. The fixed-rate 8% mortgage amortizes over 30 years. Repairs, special assessments, tax reassessments, depreciation, income taxes, rent-control restrictions and major capital events are excluded. The model is not a forecast.
| Year | Monthly rent | NOI | Debt service | Pre-tax cash flow | Loan balance |
|---|---|---|---|---|---|
| Year 1 | $2,042 | $14,499 | $13,670 | $829 | $153,953 |
| Year 2 | $2,103 | $15,105 | $13,670 | $1,435 | $152,549 |
| Year 3 | $2,166 | $15,728 | $13,670 | $2,058 | $151,027 |
| Year 4 | $2,231 | $16,371 | $13,670 | $2,701 | $149,380 |
| Year 5 | $2,298 | $17,033 | $13,670 | $3,363 | $147,596 |
| Year 6 | $2,367 | $17,715 | $13,670 | $4,045 | $145,664 |
| Year 7 | $2,438 | $18,417 | $13,670 | $4,747 | $143,571 |
| Year 8 | $2,511 | $19,140 | $13,670 | $5,470 | $141,305 |
| Year 9 | $2,587 | $19,885 | $13,670 | $6,215 | $138,851 |
| Year 10 | $2,664 | $20,653 | $13,670 | $6,983 | $136,193 |
At year ten, scheduled monthly rent would be $2,664 and NOI $20,653, conditional on uninterrupted growth and the initial unverified rent assumption. Cumulative ten-year pre-tax operating cash flow is $37,845 before exit.
07 · Exit Analysis and Sensitivity
At a hypothetical 7.50% terminal cap rate, the year-ten NOI produces a gross exit valuation of $275,367. After assumed 6% selling expenses and debt payoff, the sale would return approximately $122,653 before tax and any unmodeled capital costs. The ten-year illustrative internal rate of return (IRR) is 11.87%, calculated using modeled initial cash, ten annual cash flows and net year-ten sale proceeds. This value is highly sensitive to achievable rents, terminal cap rates and actual property condition.
Ten-year illustrative IRR: rent-growth / exit-cap sensitivity
| Annual rent growth | 6.50% exit cap | 7.50% exit cap | 8.50% exit cap |
|---|---|---|---|
| 1.00% | 7.94% | 4.49% | 0.88% |
| 3.00% | 14.41% | 11.87% | 9.47% |
| 5.00% | 19.50% | 17.36% | 15.43% |
The table is a genuine 10-year cash-flow IRR calculation on the hypothetical reverse-underwriting starting rent. It is not a market-supported expected return. It excludes tax, material repairs, special assessments, insurance spikes and other due-diligence unknowns.
08 · Market, Condition and Compliance Review
Market rent comparables
Unverified. Obtain at least three currently available or recently leased comparable homes, with addresses, bedroom count, condition, date, source, asking versus achieved rent, and documented adjustments.
Condition and capital work
Unverified. Review the HUD property-condition report, addenda, utilities, pest, roof, HVAC, foundation and occupancy, then obtain scope-specific contractor bids and a contingency allowance.
Property operating data
Unverified. Retrieve county tax record, homeowner/hazard insurance quote, actual HOA dues and rental restrictions, municipal license requirements, utilities and property management proposals.
Regulatory review
Unverified. Confirm county/city rent regulation, AB 1482 applicability and exemptions, short-term rental restrictions, local safety and occupancy rules, and HUD bidding eligibility.
09 · Sources, Limitations and Editorial Decision
HUD Home Store — Case 194-216133 (primary source) · HUD property flyer · Official HUD inventory
HUD properties may be placed under contract or sold between editorial preparation and reader access. Readers must confirm current status, eligibility, bid periods, fees, disclosures and price at the source immediately before action. Your Power Is Now to act—but only on verified information.
This independent educational analysis is not a HUD publication, appraisal, broker price opinion, financing commitment or assurance of investment return. All target-rent scenarios, modeled costs, rates, projections and valuations are explicitly hypothetical. This research draft should not be inserted into a member issue without source evidence, final arithmetic verification and author approval.
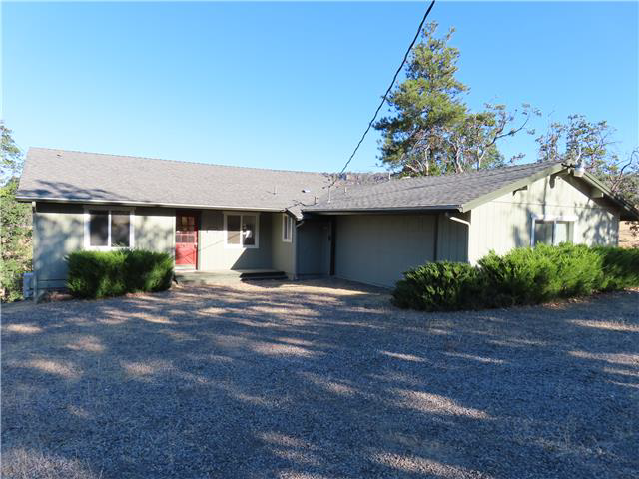
17025 Patricia Ave
Montague, CA 96064
$141,000 asking
At the asking price
$940/mo gross rent for an 8% gross yield
$8,460/yr NOI for a 6% cap rate
$11,280/yr NOI for an 8% cap rate
Illustrative Deal Analyzer · 17025 Patricia Ave
Educational scenarios, not a rent appraisal, lender quote, repair bid, or offer recommendation. Asking price is from the displayed HUD listing snapshot; every other amount below is a modeling assumption. Confirm listing status and bidding rules with HUD.
Investor scenario · 7% and 8% cap-rate illustrations
Expenses: 1.2% of asking for property tax; 0.5% for insurance; 5% of gross rent for vacancy; 8% maintenance; 8% management; 5% capital reserves; 3% miscellaneous. Cap-rate prices equal modeled NOI divided by 0.07 or 0.08. Financing and acquisition costs are excluded from cap-rate calculations.
Investor financing illustration
Financing assumes purchase at the displayed asking price. Cash flow excludes closing costs, points, taxes on investor income, and property-specific unexpected repairs. Lending terms and qualification differ by borrower.
Owner-occupant purchase and renovation illustration
A possible FHA 203(k) renovation illustration only. Actual eligible acquisition and repair amounts, the financed base, minimum investment, mortgage insurance, escrow, interest rate, closing costs, contractor bids and lender approval must be determined separately. The repair allowance is a placeholder, not an estimate of the property’s condition.
Before deciding: Confirm allowable HUD bidder category and bid deadline; obtain current rent comparables, condition report, insurance and tax quotes, inspection and renovation bids, and written financing terms. Check HUD case 049-203147.
Investment Property Analysis
17025 Patricia Ave, Montague, California · HUD Case 049-203147
ILLUSTRATIVE INVESTMENT ANALYSISPrepared November 16, 2026 · Eric Lawrence Frazier, MBA · DRE 01143484 · NMLS 461807
01 · Acquisition Summary & Investment Decision
The HUD asking price is $141,000. This report evaluates whether the property could support a 7% or 8% capitalization-rate investment and separately describes an owner-occupant purchase. The available source does not establish obtainable rent, condition-adjusted value, contractor costs, insurability or lender eligibility. Consequently, an investment purchase recommendation is withheld pending diligence, not converted from hypothetical rents into a false offer.
Property facts
Single Family Home; 3 bedrooms, 2 baths, 1324 square feet. HOA: $0 monthly. HUD financing classification: IE.
Investor rental restrictions, HOA disclosures, property damage and occupancy have not been independently reviewed.
Evidence classification
HUD listing data Prior official page check for the values shown; current marketability requires recheck.
Modeled assumptions All rents and expense percentages in this report are sensitivity illustrations, not property-specific comps or bids.
02 · Investor Underwriting Method and Required Rent
These are reverse-underwriting scenarios: they calculate the monthly rent the listing would need to justify the asking price at target capitalization rates. They do not claim those rents can be collected. A local market-rent study, unit condition and rental restrictions must determine the actual rent input.
| Measure | 7% target scenario | 8% target scenario |
|---|---|---|
| Required monthly rent | $1,391 | $1,533 |
| Required annual scheduled rent | $16,692 | $18,396 |
| Annual NOI at that hypothetical rent | $9,877 | $11,281 |
| Target yield | 7.00% | 8.00% |
| Monthly rent as % of listing price | 0.99% | 1.09% |
03 · Operating Statement — Year One
Property-specific accounting: 5% vacancy, management equal to 8% of effective income, annual replacement reserve at 5% of gross rents, 1% of asking price for ordinary maintenance, 1.25% tax, 0.5% insurance, and the indicated HOA fee. These are underwriting inputs only; none substitutes for tax records, insurance quotation or service contracts.
| Income / expense line | 7% reverse scenario | 8% reverse scenario |
|---|---|---|
| Gross scheduled rent · threshold assumption | $16,692 | $18,396 |
| Vacancy/credit loss (5%) | −$835 | −$920 |
| Effective gross income | $15,857 | $17,476 |
| Management (8% of effective income) | −$1,269 | −$1,398 |
| Replacement reserve (5% gross) | −$835 | −$920 |
| Maintenance reserve (1% price) | −$1,410 | −$1,410 |
| Illustrative tax (1.25% price) | −$1,763 | −$1,763 |
| Illustrative insurance (0.5% price) | −$705 | −$705 |
| HOA per listing | −$0 | −$0 |
| Total operating costs and reserves | −$5,981 | −$6,195 |
| MODELED NOI | $9,877 | $11,281 |
| Cap rate at HUD asking price | 7.00% | 8.00% |
NOI includes an analytical replacement reserve for conservative modeling; lenders and appraisers may use different standardized definitions. Costs grow with rent only where explicitly modeled below; taxes and insurance are held at the initial price proxy for this working model.
04 · Financing & Capital Required — Investor
Illustrative financing assumes 25% down, 75% loan-to-value, fixed 8.00% annual interest and 30-year amortization. This is not a current lender quote. Investment property financing eligibility, DSCR loan sizing, property type restrictions, credit underwriting and insurance may invalidate this structure.
| Financing item | Modeled amount |
|---|---|
| Purchase price | $141,000 |
| 25% investor down payment | $35,250 |
| Illustrative first mortgage | $105,750 |
| Estimated closing cost at 3% | $4,230 |
| Total initial cash requirement before repairs/reserves | $39,480 |
| Monthly principal & interest at assumed 8% | $776 |
| Annual debt service | $9,311 |
| NOI / debt service (7% reverse scenario) | 1.06× |
| Year-one pre-tax cash flow at reverse rent | $565 |
| Year-one cash-on-cash on modeled initial cash | 1.43% |
05 · Owner-Occupant and Rehabilitation Path
If a qualified buyer intends to occupy the property, an FHA 203(k) rehabilitation mortgage may be relevant depending on appraisal, condition, eligibility and lender requirements. The arithmetic below uses a simplified 3.5% minimum-equity illustration on the asking price before a verified rehabilitation budget. Financing of improvements, contingencies, financeable fees, limits and valuation is lender-specific.
| Owner-occupant illustration | Before rehab |
|---|---|
| Acquisition price | $141,000 |
| Illustrative 3.5% down on price | $4,935 |
| Base loan before financed fees or repairs | $136,065 |
| Illustrative P&I at an assumed 7% / 30 years | $905/month |
| Mortgage insurance, property tax, HOA, homeowners insurance | Not included |
| Contractor bid, contingency, feasibility review | Required |
| FHA renovation total and actual 3.5% cash | Not established |
HUD classification review: HUD class IE: listing classification is not an FHA commitment; appraisal, property condition, rehabilitation scope and underwriting govern.
For an owner-occupant example with verified repairs B, an initial 3.5% illustration is 0.035 × (HUD purchase price + eligible financed rehabilitation costs B), subject to the maximum-mortgage and 203(k) calculations. This is not a statement that every repair dollar is financeable.
06 · Ten-Year Income, Debt and Equity Model
This sensitivity model begins with the required 7% rent—again, a hypothetical threshold, not observed rent—and assumes 3% annual rent growth. It holds fixed price-linked operating expense proxies constant and applies management/reserves to growing rent. The fixed-rate 8% mortgage amortizes over 30 years. Repairs, special assessments, tax reassessments, depreciation, income taxes, rent-control restrictions and major capital events are excluded. The model is not a forecast.
| Year | Monthly rent | NOI | Debt service | Pre-tax cash flow | Loan balance |
|---|---|---|---|---|---|
| Year 1 | $1,391 | $9,877 | $9,311 | $565 | $104,867 |
| Year 2 | $1,433 | $10,289 | $9,311 | $978 | $103,910 |
| Year 3 | $1,476 | $10,714 | $9,311 | $1,403 | $102,874 |
| Year 4 | $1,520 | $11,152 | $9,311 | $1,841 | $101,752 |
| Year 5 | $1,566 | $11,603 | $9,311 | $2,292 | $100,536 |
| Year 6 | $1,613 | $12,067 | $9,311 | $2,756 | $99,220 |
| Year 7 | $1,661 | $12,546 | $9,311 | $3,234 | $97,795 |
| Year 8 | $1,711 | $13,038 | $9,311 | $3,727 | $96,251 |
| Year 9 | $1,762 | $13,546 | $9,311 | $4,234 | $94,579 |
| Year 10 | $1,815 | $14,069 | $9,311 | $4,757 | $92,769 |
At year ten, scheduled monthly rent would be $1,815 and NOI $14,069, conditional on uninterrupted growth and the initial unverified rent assumption. Cumulative ten-year pre-tax operating cash flow is $25,787 before exit.
07 · Exit Analysis and Sensitivity
At a hypothetical 7.50% terminal cap rate, the year-ten NOI produces a gross exit valuation of $187,582. After assumed 6% selling expenses and debt payoff, the sale would return approximately $83,558 before tax and any unmodeled capital costs. The ten-year illustrative internal rate of return (IRR) is 11.87%, calculated using modeled initial cash, ten annual cash flows and net year-ten sale proceeds. This value is highly sensitive to achievable rents, terminal cap rates and actual property condition.
Ten-year illustrative IRR: rent-growth / exit-cap sensitivity
| Annual rent growth | 6.50% exit cap | 7.50% exit cap | 8.50% exit cap |
|---|---|---|---|
| 1.00% | 7.94% | 4.50% | 0.88% |
| 3.00% | 14.41% | 11.87% | 9.47% |
| 5.00% | 19.50% | 17.37% | 15.43% |
The table is a genuine 10-year cash-flow IRR calculation on the hypothetical reverse-underwriting starting rent. It is not a market-supported expected return. It excludes tax, material repairs, special assessments, insurance spikes and other due-diligence unknowns.
08 · Market, Condition and Compliance Review
Market rent comparables
Unverified. Obtain at least three currently available or recently leased comparable homes, with addresses, bedroom count, condition, date, source, asking versus achieved rent, and documented adjustments.
Condition and capital work
Unverified. Review the HUD property-condition report, addenda, utilities, pest, roof, HVAC, foundation and occupancy, then obtain scope-specific contractor bids and a contingency allowance.
Property operating data
Unverified. Retrieve county tax record, homeowner/hazard insurance quote, actual HOA dues and rental restrictions, municipal license requirements, utilities and property management proposals.
Regulatory review
Unverified. Confirm county/city rent regulation, AB 1482 applicability and exemptions, short-term rental restrictions, local safety and occupancy rules, and HUD bidding eligibility.
09 · Sources, Limitations and Editorial Decision
HUD Home Store — Case 049-203147 (primary source) · HUD property flyer · Official HUD inventory
HUD properties may be placed under contract or sold between editorial preparation and reader access. Readers must confirm current status, eligibility, bid periods, fees, disclosures and price at the source immediately before action. Your Power Is Now to act—but only on verified information.
This independent educational analysis is not a HUD publication, appraisal, broker price opinion, financing commitment or assurance of investment return. All target-rent scenarios, modeled costs, rates, projections and valuations are explicitly hypothetical. This research draft should not be inserted into a member issue without source evidence, final arithmetic verification and author approval.
How to buy a HUD home
Buying to live in the home? Compare two budgets
Compare the purchase with no financed repairs against an FHA 203(k) scenario that includes eligible renovations. Use zero rental income for the homebuyer comparison. Run $25,000 and $50,000 as illustrative renovation allowances and compare monthly housing cost and cash to close.
Read the FHA 203(k) homebuyer guide · Mortgage Resources and Rate Finder · Mortgage Advisor and free discovery meeting
A standing guide for investors and real estate agents.
For investors
- Check the case. Find the property on HUD Home Store. Confirm the case number, availability, eligible bidder types, bid deadline and time zone. HUD may open unsold properties to investors during the extended period. Confirm investor eligibility on the individual case page.
- Review the property and financing. Read the listing, condition report and addenda. Ask your broker about access and inspections. Estimate repairs, rent, vacancy and holding costs, and confirm that your lender can finance the property in its current condition. Prepare the proof of funds or financing documents called for in the bid instructions.
- Submit through a HUD-registered broker. Give your broker the bid amount and accurate buyer and occupancy information. Confirm how the broker will notify you of the result and what funds and documents you’ll need if HUD accepts the bid.
For agents and brokers
- Verify bidding access. Confirm your brokerage’s HUD registration and active Name and Address Identifier (NAID), and check that the bidder account is authorized to submit for the brokerage.
- Recheck the listing before submitting. Verify the case number, buyer type, bid deadline and asset manager’s instructions. Review the disclosures and applicable addenda with the buyer. Enter the bid through HUD Home Store and retain the confirmation.
- Track acceptance and closing. Monitor the bid status. If accepted, follow the asset manager’s instructions for the sales contract, earnest money and required documents. Confirm the inspection, financing and closing deadlines in the executed contract.
Confirm property-specific requirements with the listing’s asset manager and your broker before bidding. HUD Home Store · HUD sales and broker registration guidance · HUD Home Store buyer FAQ
Housing and mortgage news
California real estate
California Department of Real Estate news clips · RSS
Federal Reserve
Federal Reserve monetary policy · RSS
Federal Home Loan Banks
Council of Federal Home Loan Banks news · RSS · FHLBank San Francisco