




Now we come to the numbers. In Part Two, I explained how 200 percent of area median income determines the upper boundary for eligibility. In Part Three, we examined the second mortgage, its possible interest rates and the pressure monthly payments can put on a household’s cash flow. The next step is to take those calculations into the real housing market.
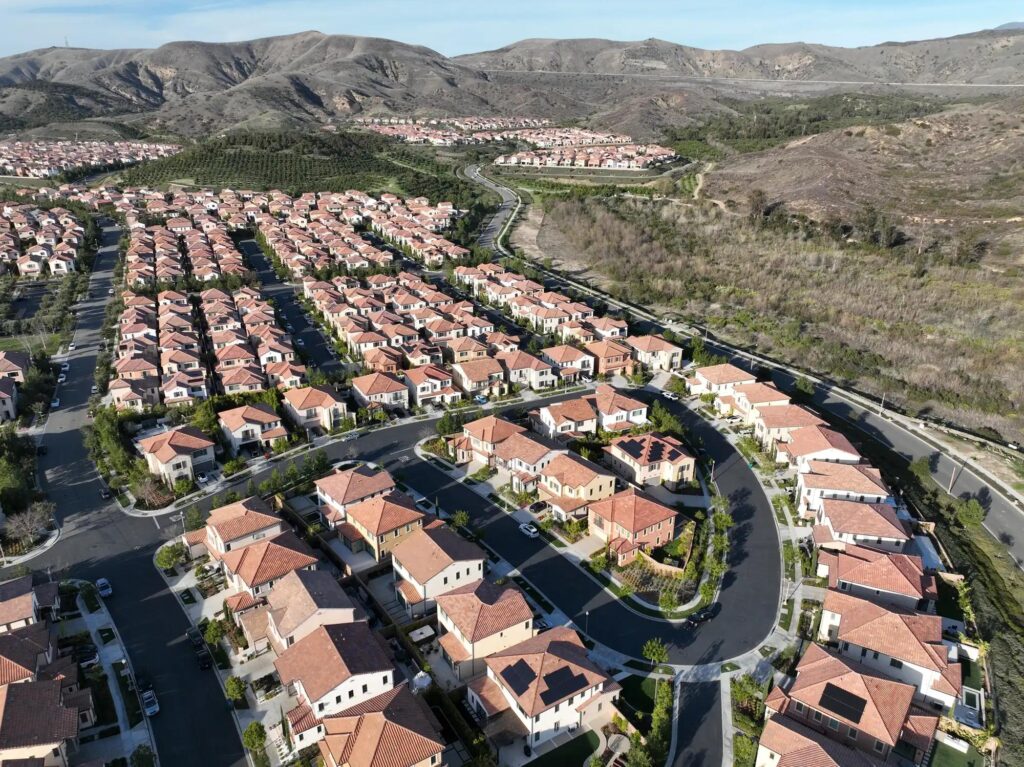
I promised to examine ten of California’s largest counties, and that is what we are going to do. I want readers to see actual homes and communities being advertised by builders, rather than one statewide average that conceals the differences between Fresno, Riverside, Los Angeles and Santa Clara County.
One thing becomes clear before we even calculate the payments. Home prices vary dramatically across California, and so do household incomes. A financing program that looks reasonable in one county can look entirely different in another. That is why the same promise of 17 percent assistance deserves a county-by-county examination.
Where the Home Prices Come From
We identified one advertised newly constructed home or community starting price in each of the ten counties, using the builders’ own websites. Some prices refer to a floor plan with possible lot premiums or additional solar costs; others refer to a specific advertised inventory home. They are examples of what buyers were being offered when the information was collected on October 21, 2026.
I want to make good use of these numbers. They give us actual price points for the financing discussion. A countywide median would require a broader study of builders, active inventory and completed transactions. That separate research is already identified. Here we can take a specific advertised price, apply the same financing assumptions in each county and see what happens to the household payment.
We also have to remember that a builder may advertise one amount while the purchaser ultimately pays more for a particular lot, options, required solar equipment, assessments or homeowners association costs. That distinction matters especially in California, where new communities can carry significant recurring assessments and fees.
How We Calculated the Payments
The model begins with the structure we examined in Part Three. The family contributes 3 percent of the purchase price. The first mortgage finances 80 percent at an illustrative 7.40 percent fixed rate over 30 years. The second mortgage finances the remaining 17 percent and is paid over 15 years.
For our principal comparison, the second carries the same 7.40 percent rate as the first. Golden State Finance Authority has historically used that equal-rate, 15-year amortizing second-mortgage structure in assistance programs, although its actual assistance loans are substantially smaller. We also calculate a second mortgage at 9.40 percent as a higher-rate stress test. That two-percentage-point increase is our assumption for understanding sensitivity, rather than a published Proposition 37 rate.¹²
To the combined principal and interest, we add annual property taxes at an assumed 1.20 percent of the advertised price and hazard insurance at an assumed 0.35 percent. For a straightforward comparison, we use 31 percent of gross household income as our housing-expense screen. That is a financial planning benchmark used in this analysis. Mortgage approval depends on the lender’s actual qualifying ratios, other debts, assets and the program’s eventual rules.
We compare the income required under that screen with twice each county’s 2026 four-person AMI benchmark from California’s Department of Housing and Community Development.¹¹ The county examples are measured on the same terms. HOA dues, Mello-Roos and other special assessments, maintenance, utilities, other debts and closing costs would add to the family’s real financial obligations.
What the Ten Counties Show
In each county, the figures below give the builder’s advertised price, the modeled monthly housing expense with the 7.40 percent second mortgage, the annual household income required for our 31 percent housing screen, and the illustrative 200 percent AMI ceiling. The higher-rate 9.40 percent second mortgage is shown as the final monthly figure.
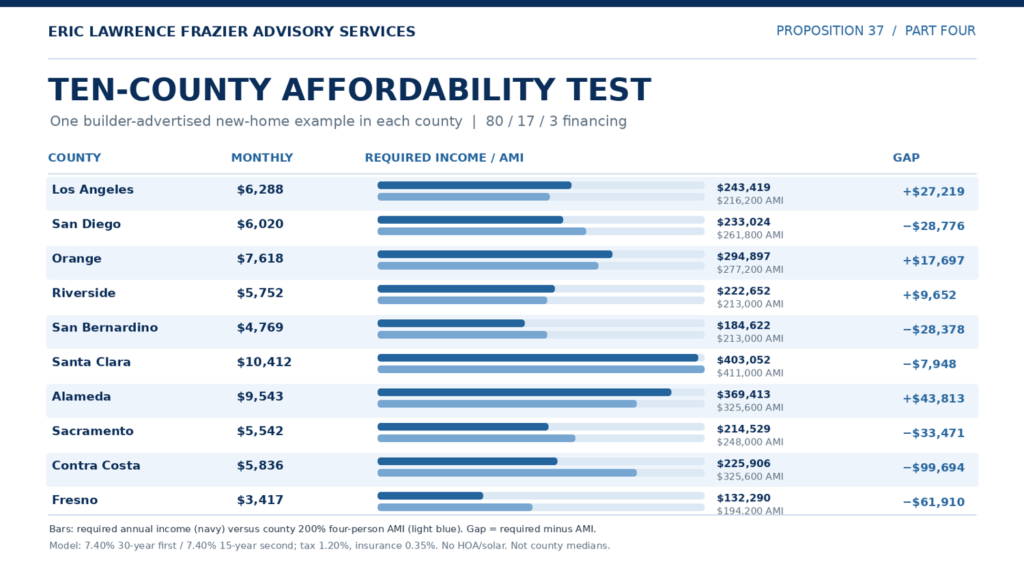
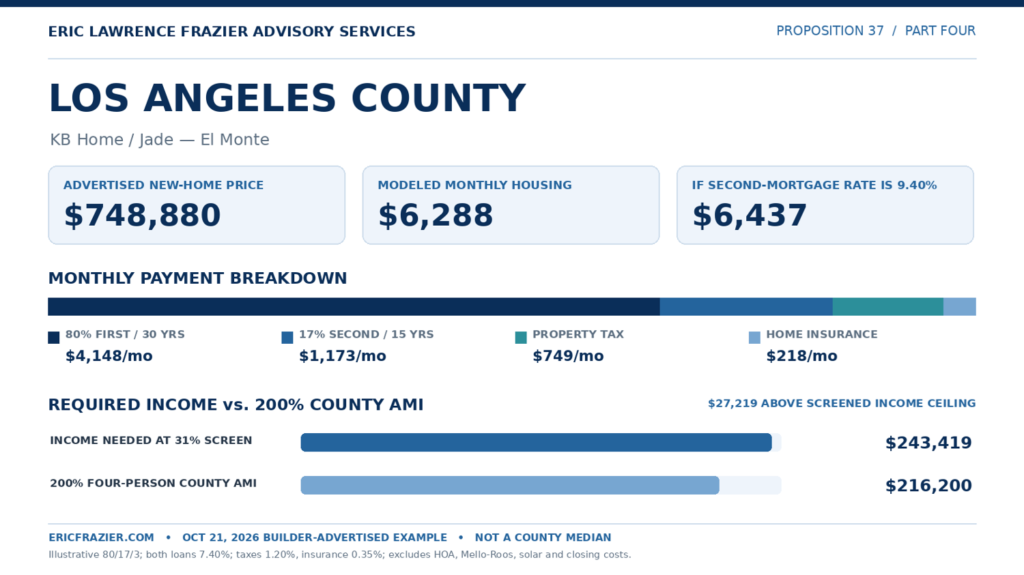
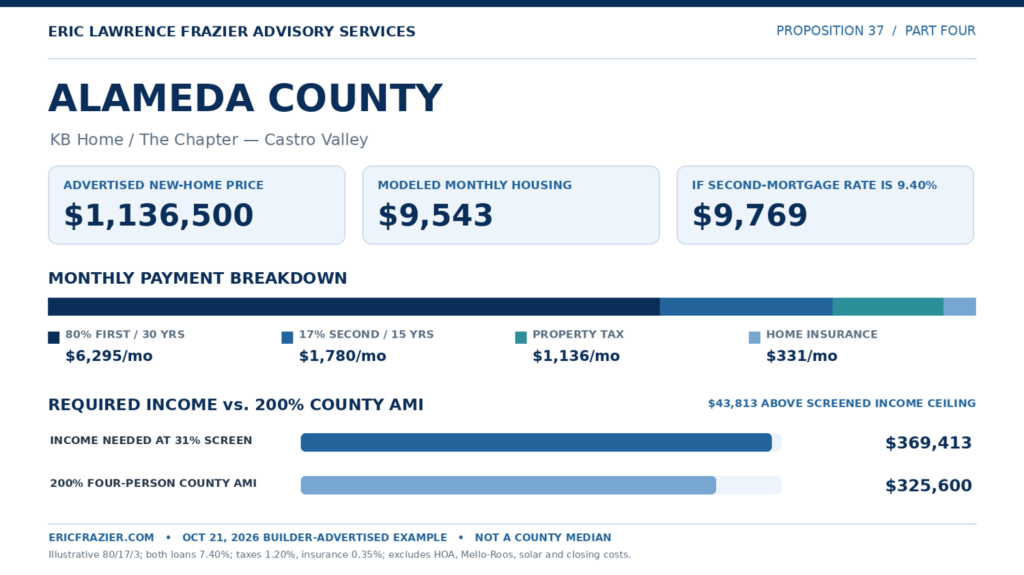
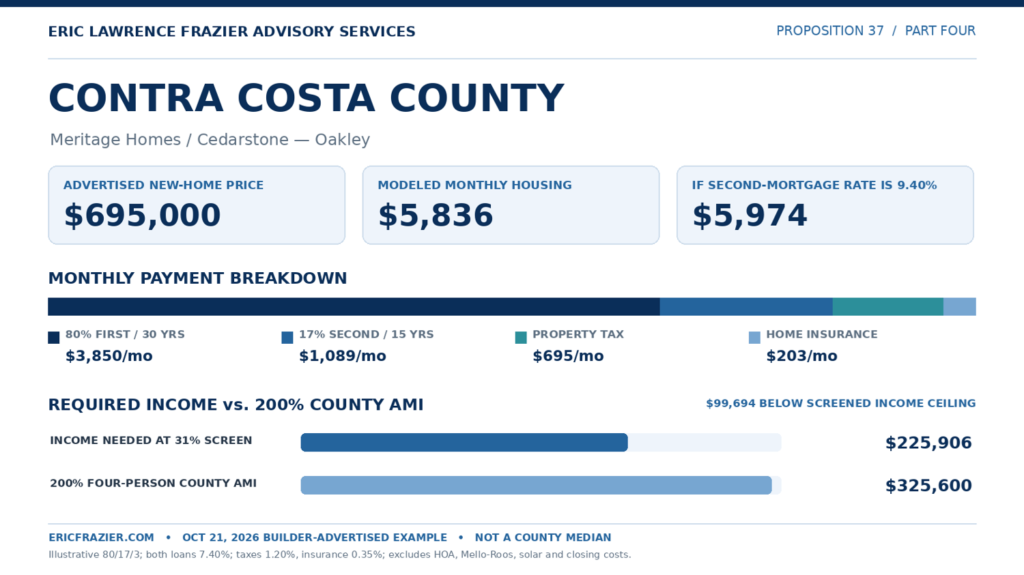
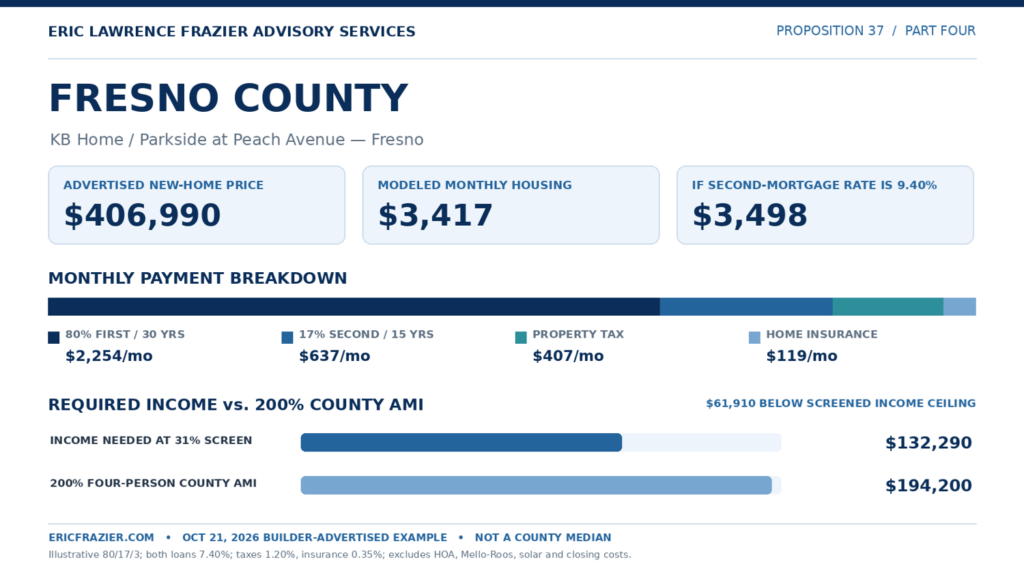
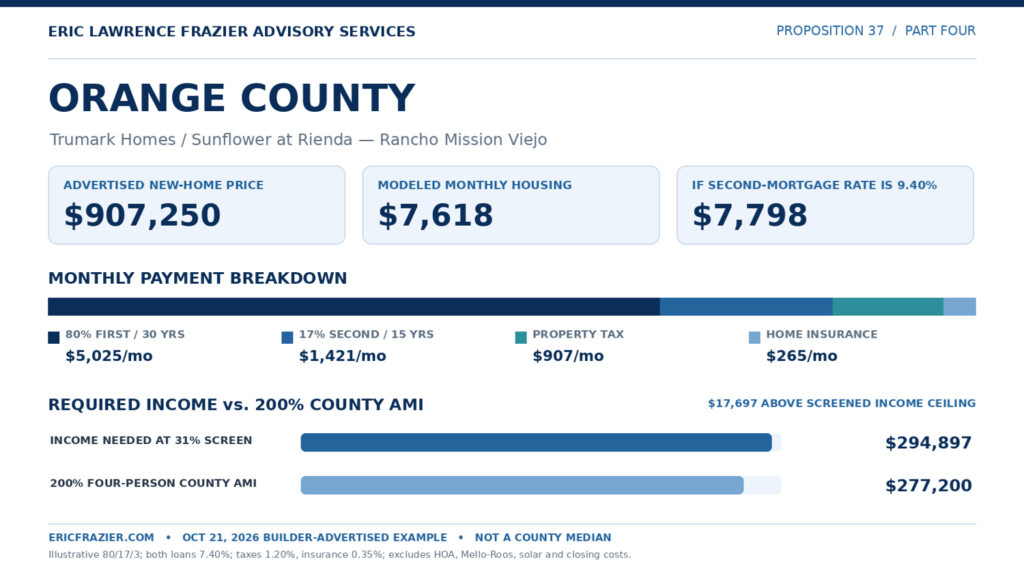
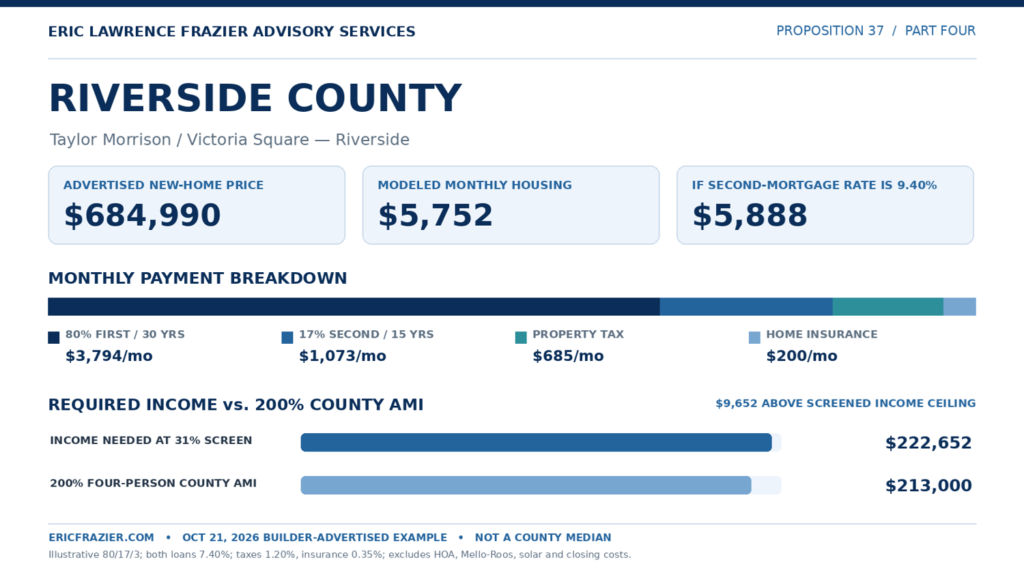
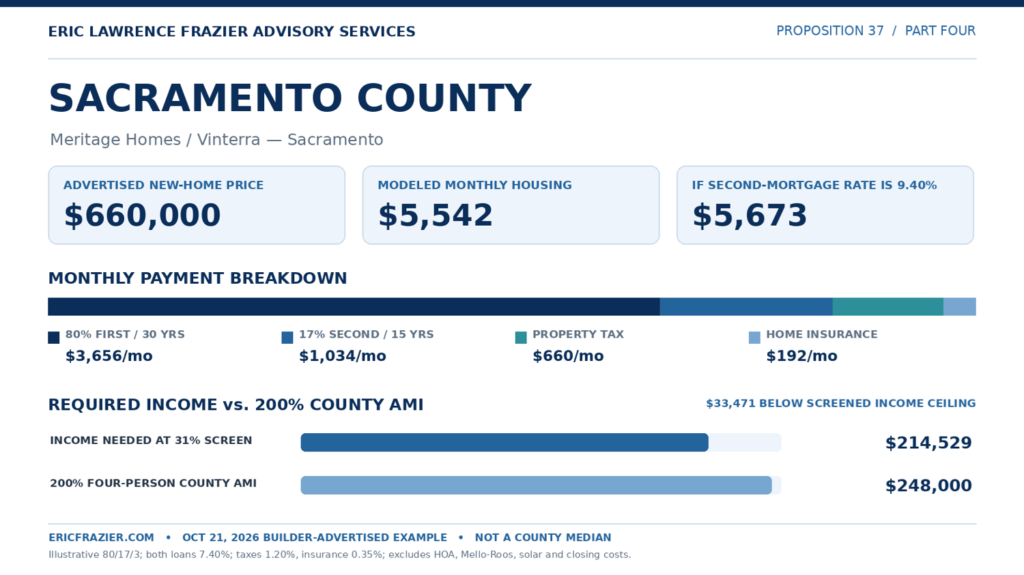
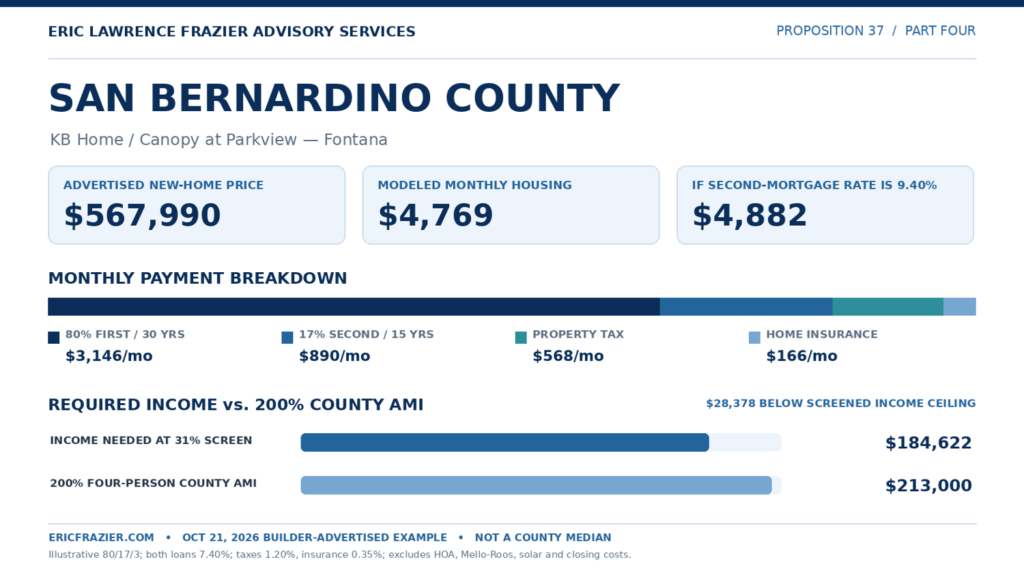
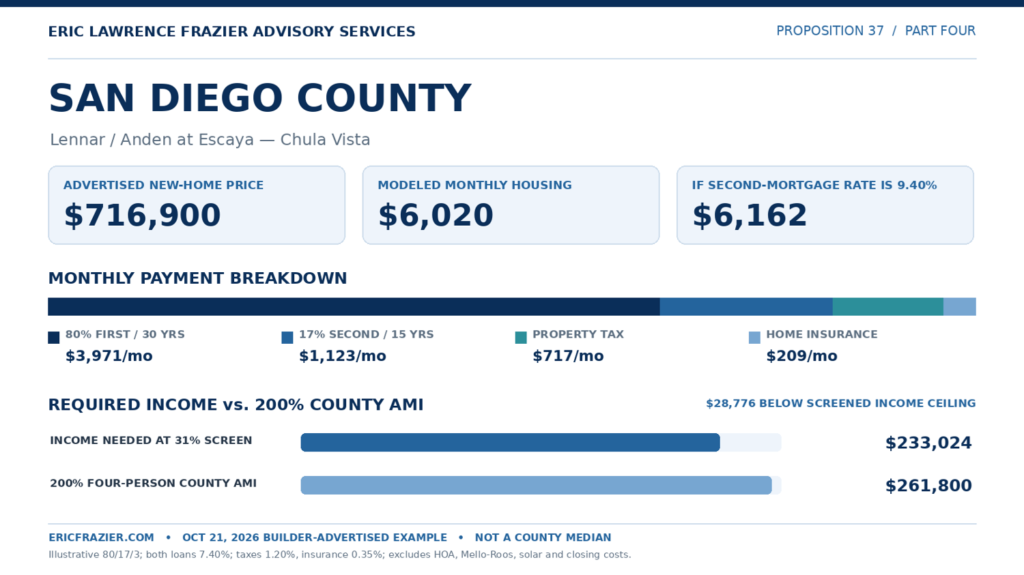
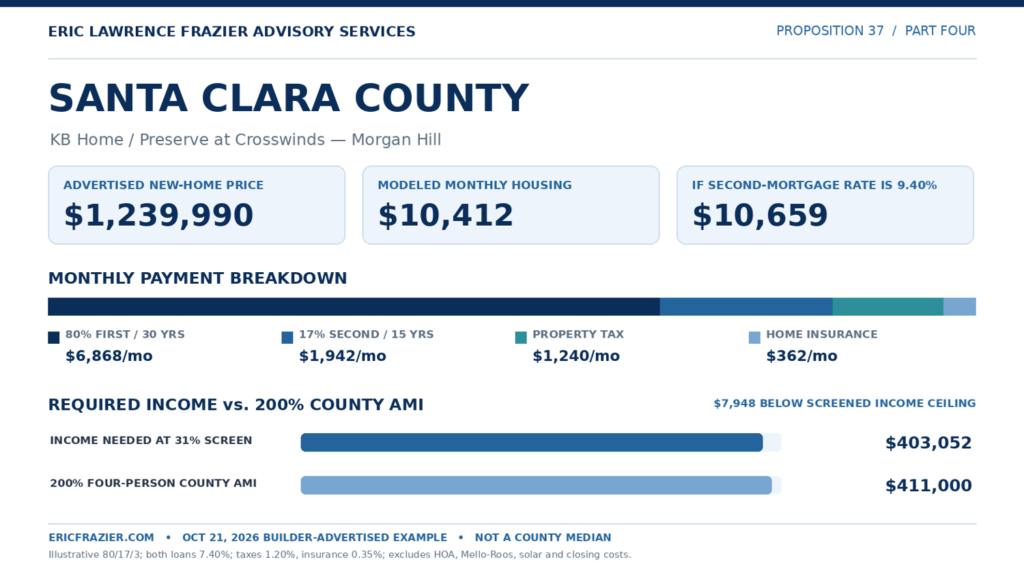
What stands out to me is the variation. Under these selected prices and financing assumptions, the income needed under our 31 percent screen exceeds the illustrated program ceiling in Los Angeles, Orange, Riverside and Alameda counties. In the higher-rate second-mortgage scenario, Santa Clara joins them. These are findings about ten selected price examples, each with different locations and home types. They tell us where affordability questions become pressing and why actual second-mortgage terms will matter.
Let’s Look More Closely at Riverside
Riverside is a useful example because it brings the issue into focus. Taylor Morrison advertised a new Plan 1 home for $684,990. The four-person AMI benchmark is $106,500, so this home is priced at approximately 6.43 times that family’s annual median income.
Here is the financing. Three percent buyer cash would be $20,549.70, before closing costs. The first mortgage, at 80 percent, would be $547,992. The second mortgage, at 17 percent, would be $116,448.30.
Using 7.40 percent for the first mortgage over 30 years, principal and interest come to approximately $3,794 monthly. A 15-year second at the same rate adds another $1,073. Our modeled property tax is about $685 monthly, and insurance adds about $200. Together, that is approximately $5,752 a month for housing before the expenses we have excluded.
A family earning Riverside’s four-person AMI receives $8,875 in gross income monthly. The modeled housing payment consumes about 64.8 percent of gross income. If take-home pay is hypothetically 75 percent of gross, that family has about $6,656 deposited each month. Housing would take approximately 86.4 percent of that money. Think about everything the family still needs to pay for.
Now move the income up to twice the AMI, or $213,000 per year. That same $5,752 monthly housing expense represents about 32.4 percent of gross income. Under our 31 percent housing screen, the family would need approximately $222,652 annually. That is about $9,652 above the illustrative $213,000 income ceiling.
A lender might approve a family with a housing ratio above 31 percent, depending on actual debt, income and underwriting rules. That is why the calculation is a financial-pressure test. Our objective is to understand the household budget as well as mortgage eligibility.
There is also a more favorable possibility. Imagine that the 17 percent second mortgage carried zero interest and all payments were deferred until a later event. The modeled monthly Riverside housing expense would fall to approximately $4,679, while the $116,448 second-mortgage principal would remain owed. Similar deferred assistance structures exist in California on much smaller loans. CalHFA would need to establish whether that kind of financing could work within Proposition 37’s revenue-bond requirements.¹³
That comparison tells me why voters deserve to see the actual terms before deciding what the measure might accomplish. A change in repayment structure can make a meaningful difference to a family’s monthly cash flow.
The Benefit We Need to Measure
There are financially qualified people who will benefit from assistance like this. Some have strong incomes and enough savings to make a purchase. Some may prefer to preserve their own cash and use a favorable second mortgage. If builders lower prices or offer incentives in a slower market, those buyers may find excellent opportunities.
I understand the attraction. From the buyer’s perspective, it can be a smart use of available financing.
From California’s perspective, the test has to go further. How many households become homeowners because of this assistance? How many people receive financing advantages on transactions they would have completed anyway? How many additional homes will builders actually produce because these loans exist?
Those outcomes deserve separate numbers. A loan recipient is a beneficiary. A newly created homeowner is an additional outcome. A newly built home that comes to market because of a program is another outcome. We need to measure all three if we want to know how effective the policy really is.
The Question That Comes Next
We have now examined a ten-county sample of newly constructed homes using prices advertised by the builders themselves. We have applied a consistent mortgage structure, tested the effect of a higher second-mortgage rate and compared the resulting payments with local four-person income benchmarks.
The results reinforce the central concern of this series. Making a down payment easier can help qualified purchasers, while the complete monthly obligation determines how comfortably they can remain homeowners. A second mortgage for 17 percent of the price is substantial financing, and its terms can change the outcome.
For California to measure success, we need to know how many families actually occupy the space between eligibility and affordability. We need to know how many possess the cash, credit and income to purchase an eligible new home, and how many of those purchases would create additional owners.
That is where Part Five begins: the real buyer pool. We will move from ten illustrated purchases to the households of California and ask what share of the population can realistically use this $25 billion financing authority.
Thank you for taking the time to read and reflect. I write to help people think clearly about money, business, real estate, and life, grounded in decades of lived experience and informed by research.
If you are navigating a financial decision, building a business, considering homeownership, or simply trying to make better use of your time and resources, I invite you to engage further.
Subscribe to The Power Is Now TV to connect with me live every weekday, Monday through Friday, from 10:00 AM to 11:00 AM PST, as we record television shows across the Power Is Now TV Network. As a subscriber, you can participate in live tapings, engage in real-time discussions, and connect directly with industry leaders.
Visit ThePowerIsNow.com to access real estate magazines, books, podcasts, television shows, and exclusive media content focused on homeownership, business, and wealth-building.
For personalized support, consulting, and advisory services in real estate, mortgages, business, and personal finance, visit EricFrazier.com to schedule a consultation and learn more about my work as your trusted advisor in business and wealth.
Eric Lawrence Frazier, MBA
Your Trusted Advisor in Business and Wealth
Real Estate Broker CA DRE 01143484 | Mortgage Originator NMLS 461807